the Creative Commons Attribution 3.0 License.
the Creative Commons Attribution 3.0 License.
Recent changes of relative humidity: regional connections with land and ocean processes
Sergio M. Vicente-Serrano
Raquel Nieto
Luis Gimeno
Cesar Azorin-Molina
Anita Drumond
Ahmed El Kenawy
Fernando Dominguez-Castro
Miquel Tomas-Burguera
Marina Peña-Gallardo
We analyzed changes in surface relative humidity (RH) at the global scale from 1979 to 2014 using both observations and the ERA-Interim dataset. We compared the variability and trends in RH with those of land evapotranspiration and ocean evaporation in moisture source areas across a range of selected regions worldwide. The sources of moisture for each particular region were identified by integrating different observational data and model outputs into a Lagrangian approach. The aim was to account for the possible role of changes in air temperature over land, in comparison to sea surface temperature (SST), but also the role of land evapotranspiration and the ocean evaporation on RH variability. The results demonstrate that the patterns of the observed trends in RH at the global scale cannot be linked to a particular individual physical mechanism. Our results also stress that the different hypotheses that may explain the decrease in RH under a global warming scenario could act together to explain recent RH trends. Albeit with uncertainty in establishing a direct causality between RH trends and the different empirical moisture sources, we found that the observed decrease in RH in some regions can be linked to lower water supply from land evapotranspiration. In contrast, the empirical relationships also suggest that RH trends in other target regions are mainly explained by the dynamic and thermodynamic mechanisms related to the moisture supply from the oceanic source regions. Overall, while this work gives insights into the connections between RH trends and oceanic and continental processes at the global scale, further investigation is still desired to assess the contribution of both dynamic and thermodynamic factors to the evolution of RH over continental regions.
- Article
(8081 KB) -
Supplement
(17906 KB) - BibTeX
- EndNote


Relative humidity (RH) is a key meteorological parameter that determines the aerodynamic component of the atmospheric evaporative demand (AED) (Wang and Dickinson, 2012; McVicar et al., 2012a). As such, changes in RH may significantly impact the evolution of the AED (Vicente-Serrano et al., 2014a), with particular implications for the intensity of the hydrological cycle (Sherwood, 2010), climate aridity (Sherwood and Fu, 2014), and severity of drought events (Rebetez et al., 2006; Marengo et al., 2008).
In a changing climate, temperature rise, as suggested by different climate scenarios, may impact the atmospheric humidity. Particularly, there is empirical evidence on the increase in the water vapor content at both the surface and upper tropospheric levels (Trenberth et al., 2005). In this context, numerous studies have supported the constant RH scenario under global warming conditions (e.g., Dai, 2006; Lorenz and DeWeaver, 2007; Willett et al., 2008; McCarthy et al., 2009; Ferraro et al., 2015). In contrast, other studies supported the nonstationary behavior of RH, not only in continental areas located far from oceanic humidity (e.g., Pierce et al., 2013) but also in humid regions (e.g., Van Wijngaarden and Vincent, 2004). Assuming the stationary behavior of RH, the influence of RH on AED may be constrained, given that any possible change in AED would be mostly determined by changes in other aerodynamic variables (e.g., air temperature and wind speed) (McVicar et al., 2012a, b) or by changes in cloudiness and solar radiation (Roderick and Farquhar, 2002; Fan and Thomas, 2013). However, a range of studies have supported the nonstationary behavior of RH under global warming, giving insights into significant changes in RH over the past decades. A representative example is Simmons et al. (2010), who compared gridded observational and reanalysis RH data, suggesting a clear dominant negative trend in RH over the Northern Hemisphere since 2000. Also, based on a newly developed homogeneous gridded database that employed the most available stations from the telecommunication system of the WMO, Willett et al. (2014) found significant negative changes in RH, with strong spatial variability, at the global scale. This global pattern was also confirmed at the regional scale, but with different signs of change, including both negative (e.g., Vincent et al., 2007; Vicente-Serrano et al., 2014b, 2016; Zongxing et al., 2014) and positive trends (e.g., Shenbin et al., 2006; Jhajharia et al., 2009; Hosseinzadeh Talaee et al., 2012).
There are different hypotheses that explain the nonstationary evolution of RH under global warming conditions. One of these hypotheses is related to the slower warming of oceans in comparison to continental areas (Lambert and Chiang, 2007; Joshi et al., 2008). In particular, specific humidity of air advected from oceans to continents increases more slowly than saturation specific humidity increases over land (Rowell and Jones, 2006; Fasullo, 2010). This would decrease RH over continental areas, inducing an increase in AED and aridity conditions (Sherwood and Fu, 2014). Some studies employed global climate models (GCMs) to support this hypothesis under future warming conditions (e.g., Joshi et al., 2008; O'Gorman and Muller, 2010; Byrne and O'Gorman, 2013).
Another hypothesis to explain the nonstationary evolution of RH is associated with land–atmosphere feedback processes. Different studies indicated that atmospheric moisture and precipitation are strongly linked to moisture recycling in different regions of the world (e.g., Rodell et al., 2015). Thus, evapotranspiration may contribute largely to water vapor content and precipitation over land (Stohl and James, 2005; Bosilovich and Chern, 2006; Trenberth et al., 2007; Dirmeyer et al., 2009; van der Ent et al., 2010). Land–atmospheric feedbacks may also have marked influence on atmospheric humidity (Seneviratne et al., 2006), given that soil drying can suppress evapotranspiration, reduce RH, and thus reinforce AED. All these processes would again reinforce soil drying (Seneviratne et al., 2002; Berg et al., 2016).
Indeed, it is very difficult to determine which hypothesis can provide an understanding of the observed RH trends at the global scale. Probably, the two hypotheses combined together can be responsible for the observed RH trends in some regions of the world (Rowell and Jones, 2006). In addition to the aforementioned hypotheses, some dynamic forces, which are associated with atmospheric circulation processes, can explain the nonstationary behavior of RH worldwide (e.g., Goessling and Reick, 2011). However, defining the relative importance of these physical processes in different world regions is quite challenging (Zhang et al., 2013; Laua and Kim, 2015).
The objective of this study is to compare the recent variability and trends in RH with changes in the two types of fluxes that affect RH: (i) vertical fluxes that were assessed using land evapotranspiration and precipitation and (ii) advection that was quantified using oceanic evaporation from moisture source areas. The novelty of this work stems from the notion that although different studies have already employed GCMs and different scenarios to explain the possible mechanisms behind RH changes under warming conditions, we introduce a new empirical approach that employs different observational datasets, reanalysis fields, and a Lagrangian-based approach, not only for identifying the continental and oceanic moisture areas for different target regions but also for exploring the relevance of the existing hypothesis to assess the magnitude, sign, and spatial patterns of RH trends in the past decades at the global scale.
2.1 Dataset description
2.1.1 Observational RH dataset
We employed the monthly RH HadISDH dataset, available through http://www.metoffice.gov.uk/hadobs/hadisdh (last access: 25 June 2018; Willet et al., 2014). We selected only those series with no more than 20 % of missing values over the period 1979–2014. In order to fill these gaps, we created a standardized regional series for each station using the most correlated series with each target series. In order to avoid biases, mostly originated from differences in the distribution parameters (mean and variance) between the candidate and the objective data series, a bias correction was applied to the candidate data. The data of the candidate series were rescaled to match the statistical distribution of the observed series to be filled, based on the overlapping period among them. Overall, a final dataset of 3462 complete stations spanning different regions worldwide and covering the period 1979–2014 was employed in this work.
2.1.2 Reanalysis RH dataset
Daily data of dew point (Td), air temperature (T), and surface pressure (Pmst) at a spatial interval of 0.5∘ were obtained from the ERA-Interim, covering the period 1979–2014 (http://www.ecmwf.int/en/research/climate-reanalysis/era-interim, last access: 25 June 2018; Dee et al., 2011). To calculate RH, we followed the formulation used by Willett et al. (2014) for the HadISDH RH dataset. Based on the selected variables, we calculated the daily RH following Buck (1981):
where e is the actual vapor pressure in hectopascals and es is the saturated vapor pressure in hectopascals. As a function of the wet bulb air temperature (Tw) in degrees Celsius, e is estimated following two different equations with respect to water and ice. If Tw is above 0 ∘C, e is calculated as
where Td is the dew point temperature in degrees Celsius.
If Tw is below 0 ∘C, e it is calculated as
where
where Pmst is the pressure at the height level.
Tw is obtained according to Jensen et al. (1990):
where
and T is the 2 m air temperature in degrees Celsius es is obtained by substituting T for Td.
2.1.3 Land precipitation and land air temperature
We employed the gridded land precipitation and surface air temperature data (TS v.3.23), provided by the Climate Research Unit (CRU; UK), at a 0.5∘ spatial interval for the period 1979–2014 (Harris et al., 2014).
2.1.4 Sea surface temperature (SST)
We used the monthly SST data (HadSST3), compiled by the Hadley Centre for the common period 1979–2014 (http://www.metoffice.gov.uk/hadobs/hadsst3/, last access: 25 June 2018). This dataset is provided at a 0.5∘ grid interval (Kennedy et al., 2011a, b).
2.1.5 Ocean evaporation and continental evapotranspiration data
To quantify the temporal variability and trends in land evapotranspiration and oceanic evaporation, we employed two different datasets. First, the oceanic evaporation was quantified using the Objectively Analyzed air-sea Fluxes (OAFlux) product (Yu et al., 2008) from 1979 to 2014, which was used to analyze recent variability and changes in evaporation from global oceans (Yu, 2007). To account for land evapotranspiration, we employed the Global Land Evaporation Amsterdam Model (GLEAM) (version 3.0a) (http://www.gleam.eu/, last access: 25 June 2018; Miralles et al., 2011) from 1980 to 2014. This dataset has been widely validated using in situ measurements of surface soil moisture and evaporation across the globe (Martens et al., 2017).
2.2 Methods
2.2.1 Relative humidity trends
We assessed the seasonal (boreal cold season: October–March; boreal warm season: April–September) and annual trends in RH for 1979–2014 using two different global datasets (HadISDH and ERA-Interim). To quantify the magnitude of change in RH, we used a linear regression analysis between the series of time (independent variable) and RH series (dependent variable). To assess the statistical significance of the detectable changes, we applied the nonparametric Mann–Kendall statistic (Zhang et al., 2001) to account for any possible influence of serial autocorrelation on the robustness of the defined trends (Hamed and Rao, 1998; Yue and Wang, 2004). The statistical significance of the trend was tested at the 95 % confidence level (p < 0.05).
Following the trend analysis results, we selected those regions that showed a high agreement between HadISDH and ERA-Interim datasets in terms of the sign and magnitude of RH changes. Nevertheless, we also extended our selection to some other regions, with low station density in the HadISDH dataset. This decision was simply motivated by the consistent changes found over these regions, as suggested by the ERA-Interim dataset. For all the defined regions, we identified the oceanic and continental moisture sources by means of the FLEXPART Lagrangian model.
2.2.2 Identification of continental and oceanic moisture sources
We used the FLEXPART v9.0 particle dispersion model fed with the ERA-Interim reanalysis data. According to this model, the atmosphere is divided homogeneously into three-dimensional finite elements (hereafter “particles”); each represents a fraction of the total atmospheric mass (Stohl and James, 2004). These particles may be advected backward or forward in time using three-dimensional wind taken from the ERA-Interim data every time step, with superimposed stochastic turbulent and convective motions. The rates of increase (e) and decrease (p) in moisture (e–p) along the trajectory of each particle were calculated via changes in the specific humidity (q) with time (e–p = mdq ∕ dt), where m is the mass of the particle. A description of this methodology is detailed in Stohl and James (2004).
The FLEXPART dataset used in this study was provided by a global experiment in which the entire global atmosphere was divided into approximately 2.0 million particles. The tracks were computed using the ERA-Interim reanalysis data at 6 h intervals, at a 1∘ horizontal resolution, and at a vertical resolution of 60 levels from 0.1 to 1000 hPa. For each particular target region, all the particles were tracked backward in time, and its position and specific humidity (q) were recorded every 6 h. All areas where the particles gained humidity (E–P > 0) along their trajectories towards the target region can be considered to be “sources of moisture”. In contrast, all areas with lost humidity (E–P < 0) are considered to be “sinks”.
We followed the methodology of Miralles et al. (2016), in which an optimal lifetime of vapor in the atmosphere was calculated to reproduce the sources of moisture and we defined the climatological spatial extent of each source region corresponding to a particular target region by applying a 95th percentile criterion computed for the annual and seasonal (boreal summer and winter) positive (E–P) field (Vázquez et al., 2016). Then, for each year of the period, we estimated the total moisture supply from each source region. Also from FLEXPART simulations, we obtained the fractions of moisture from the continental and oceanic sources annually and for each cold and warm season. The purpose was to compare with the results obtained on the role of the land evapotranspiration and ocean evaporation in RH variability and trends.
2.2.3 Relationship between RH and the selected land–oceanic climate variables
Based on defining the spatial extent of each moisture source region, we calculated annual, warm, and cold season regional series for ocean evaporation and land evapotranspiration using the OAFlux and GLEAM datasets, respectively. The regional series of ocean evaporation and land evapotranspiration were created using a weighted average based on the seasonal and annual fields of (E–P) > 0. This approach allows the creation of a time series that better represents the interannual variability in ocean evaporation and land evapotranspiration in the source(s) of moisture for each defined region. Following the same approach, we also calculated the regional series of SST corresponding to each oceanic moisture source region. Likewise, we calculated the regional series of land precipitation and air temperature for each target region using the CRU TS v.3.23 dataset, and the ratio between air temperature in the target region and SST in the source region.
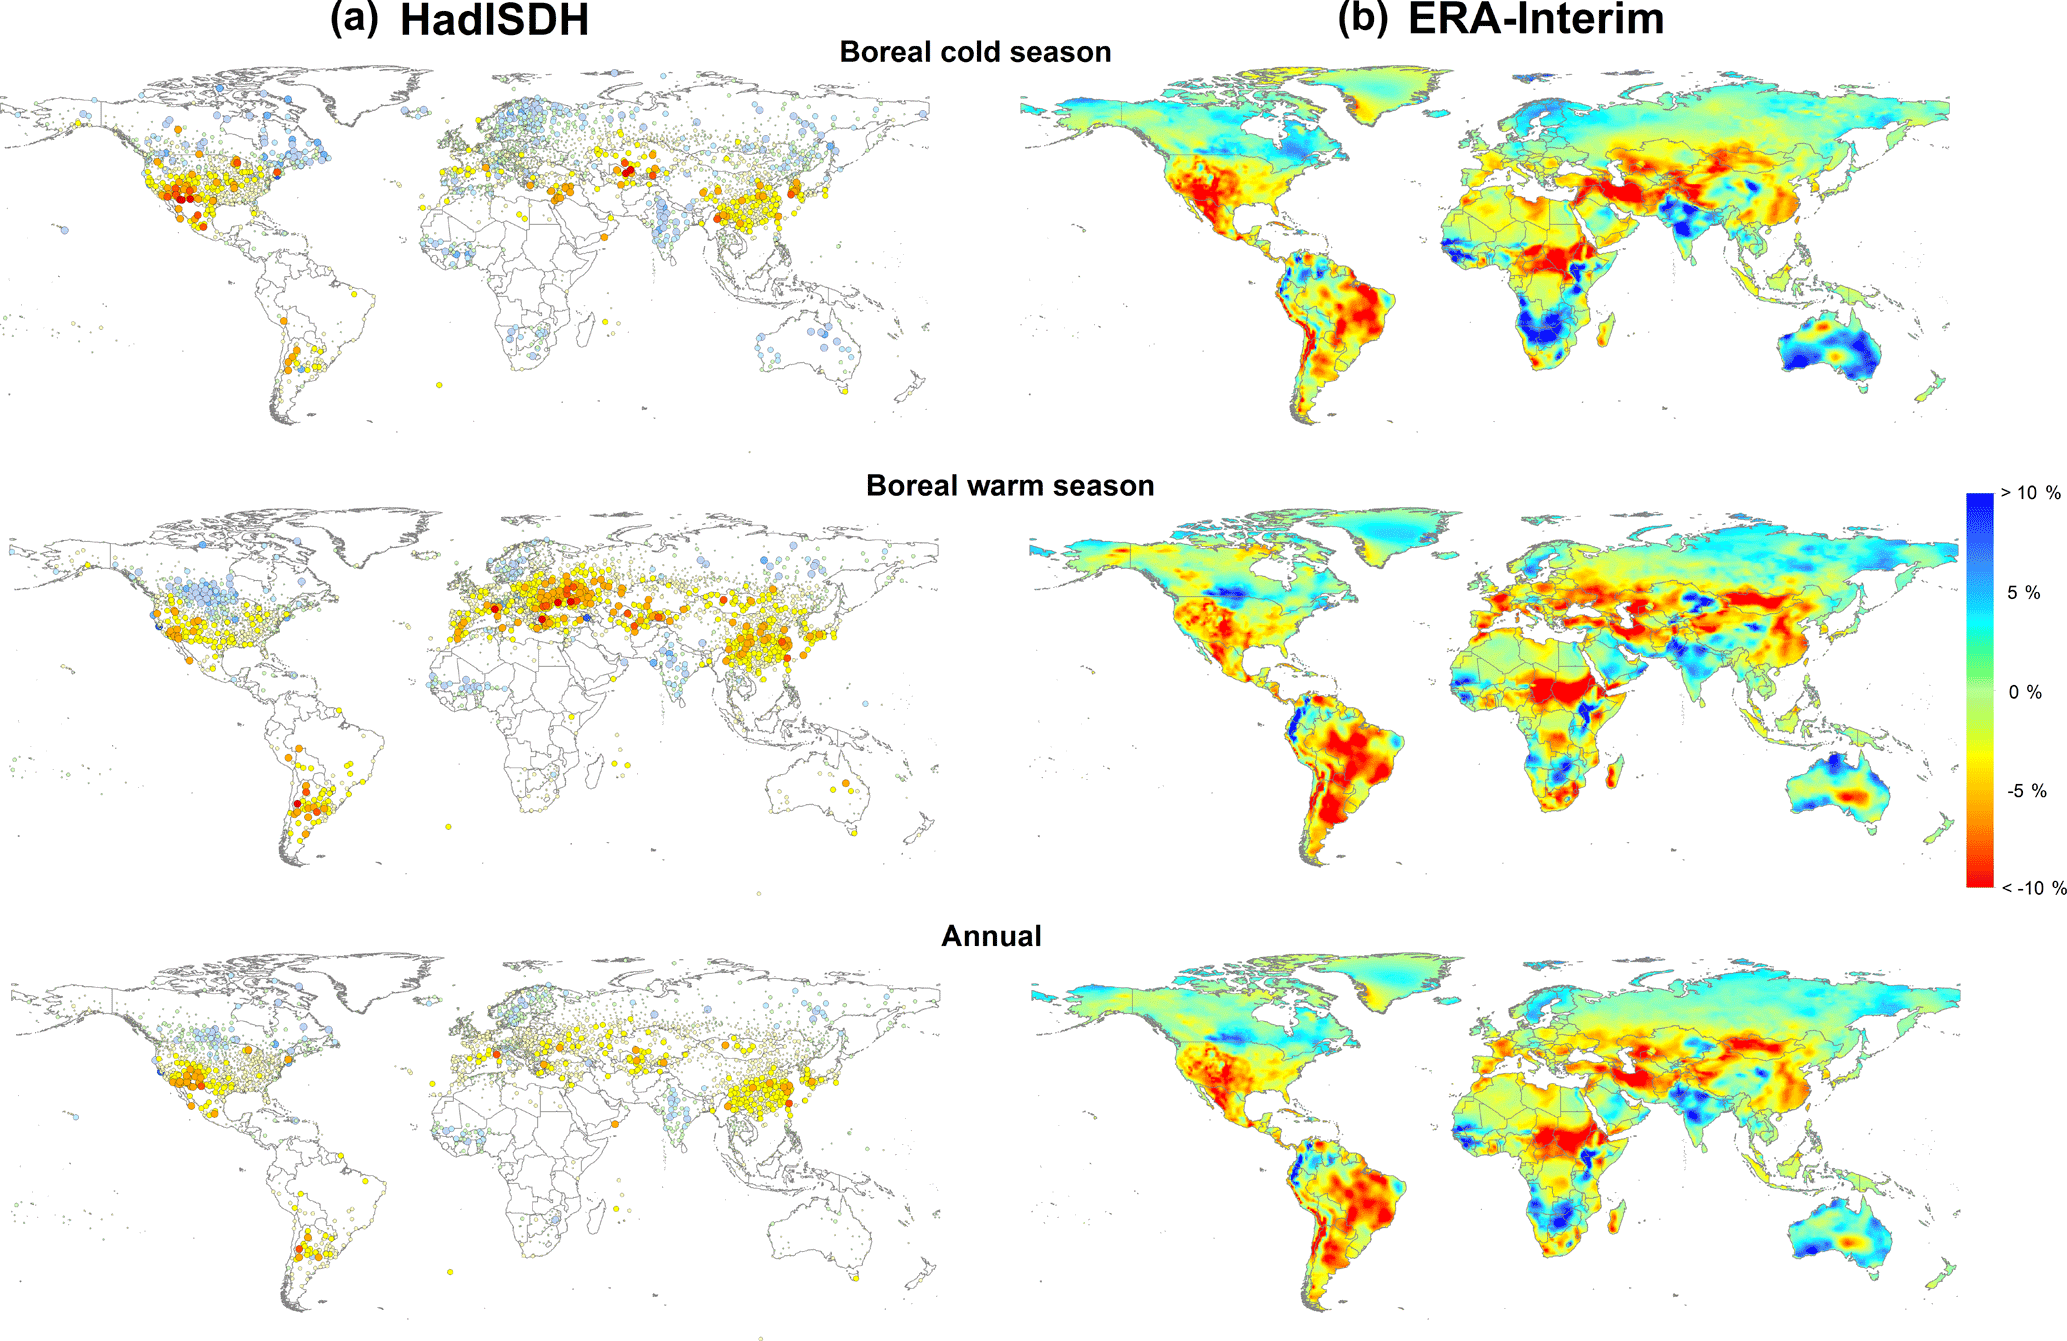
Figure 1Spatial distribution of the magnitude of change of RH (% per decade) over the period 1979–2014 from the HadISDH (a) and ERA-Interim datasets (b). Results are provided for the boreal cold (October–March) and warm (April–September) seasons and annually.
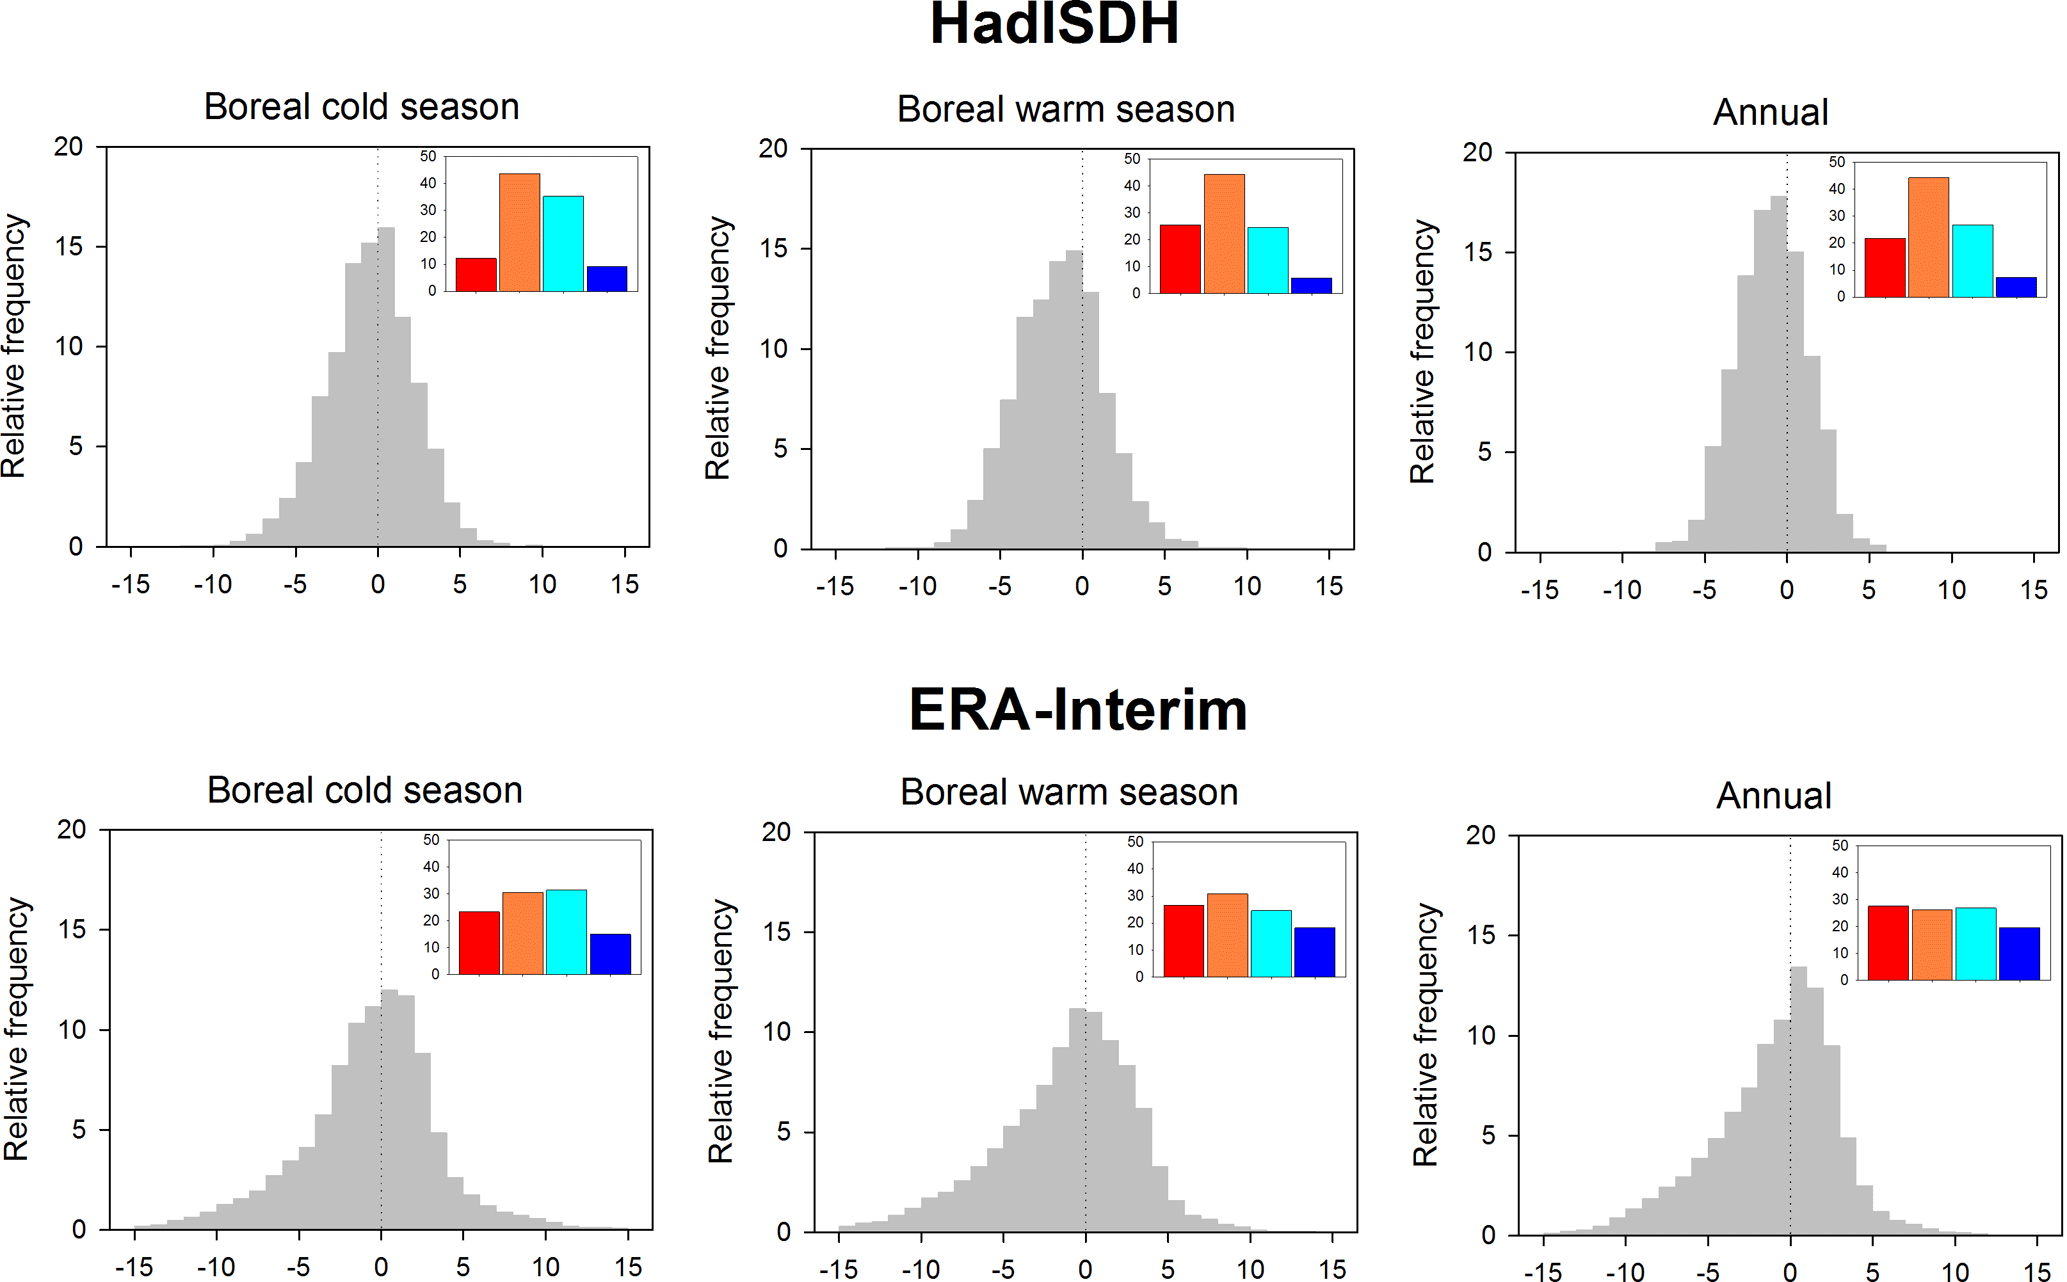
Figure 2Relative frequencies (%) of the RH magnitude of change in the HadISDH and ERA-Interim datasets. Color bar plots represent the percentage of stations (from HadISDH) and world regions (from ERA-Interim) with statistically significant positive trends at p < 0.05 (blue), statistically insignificant positive trends (cyan), statistically insignificant negative trends (orange), and statistically significant negative trends (red).
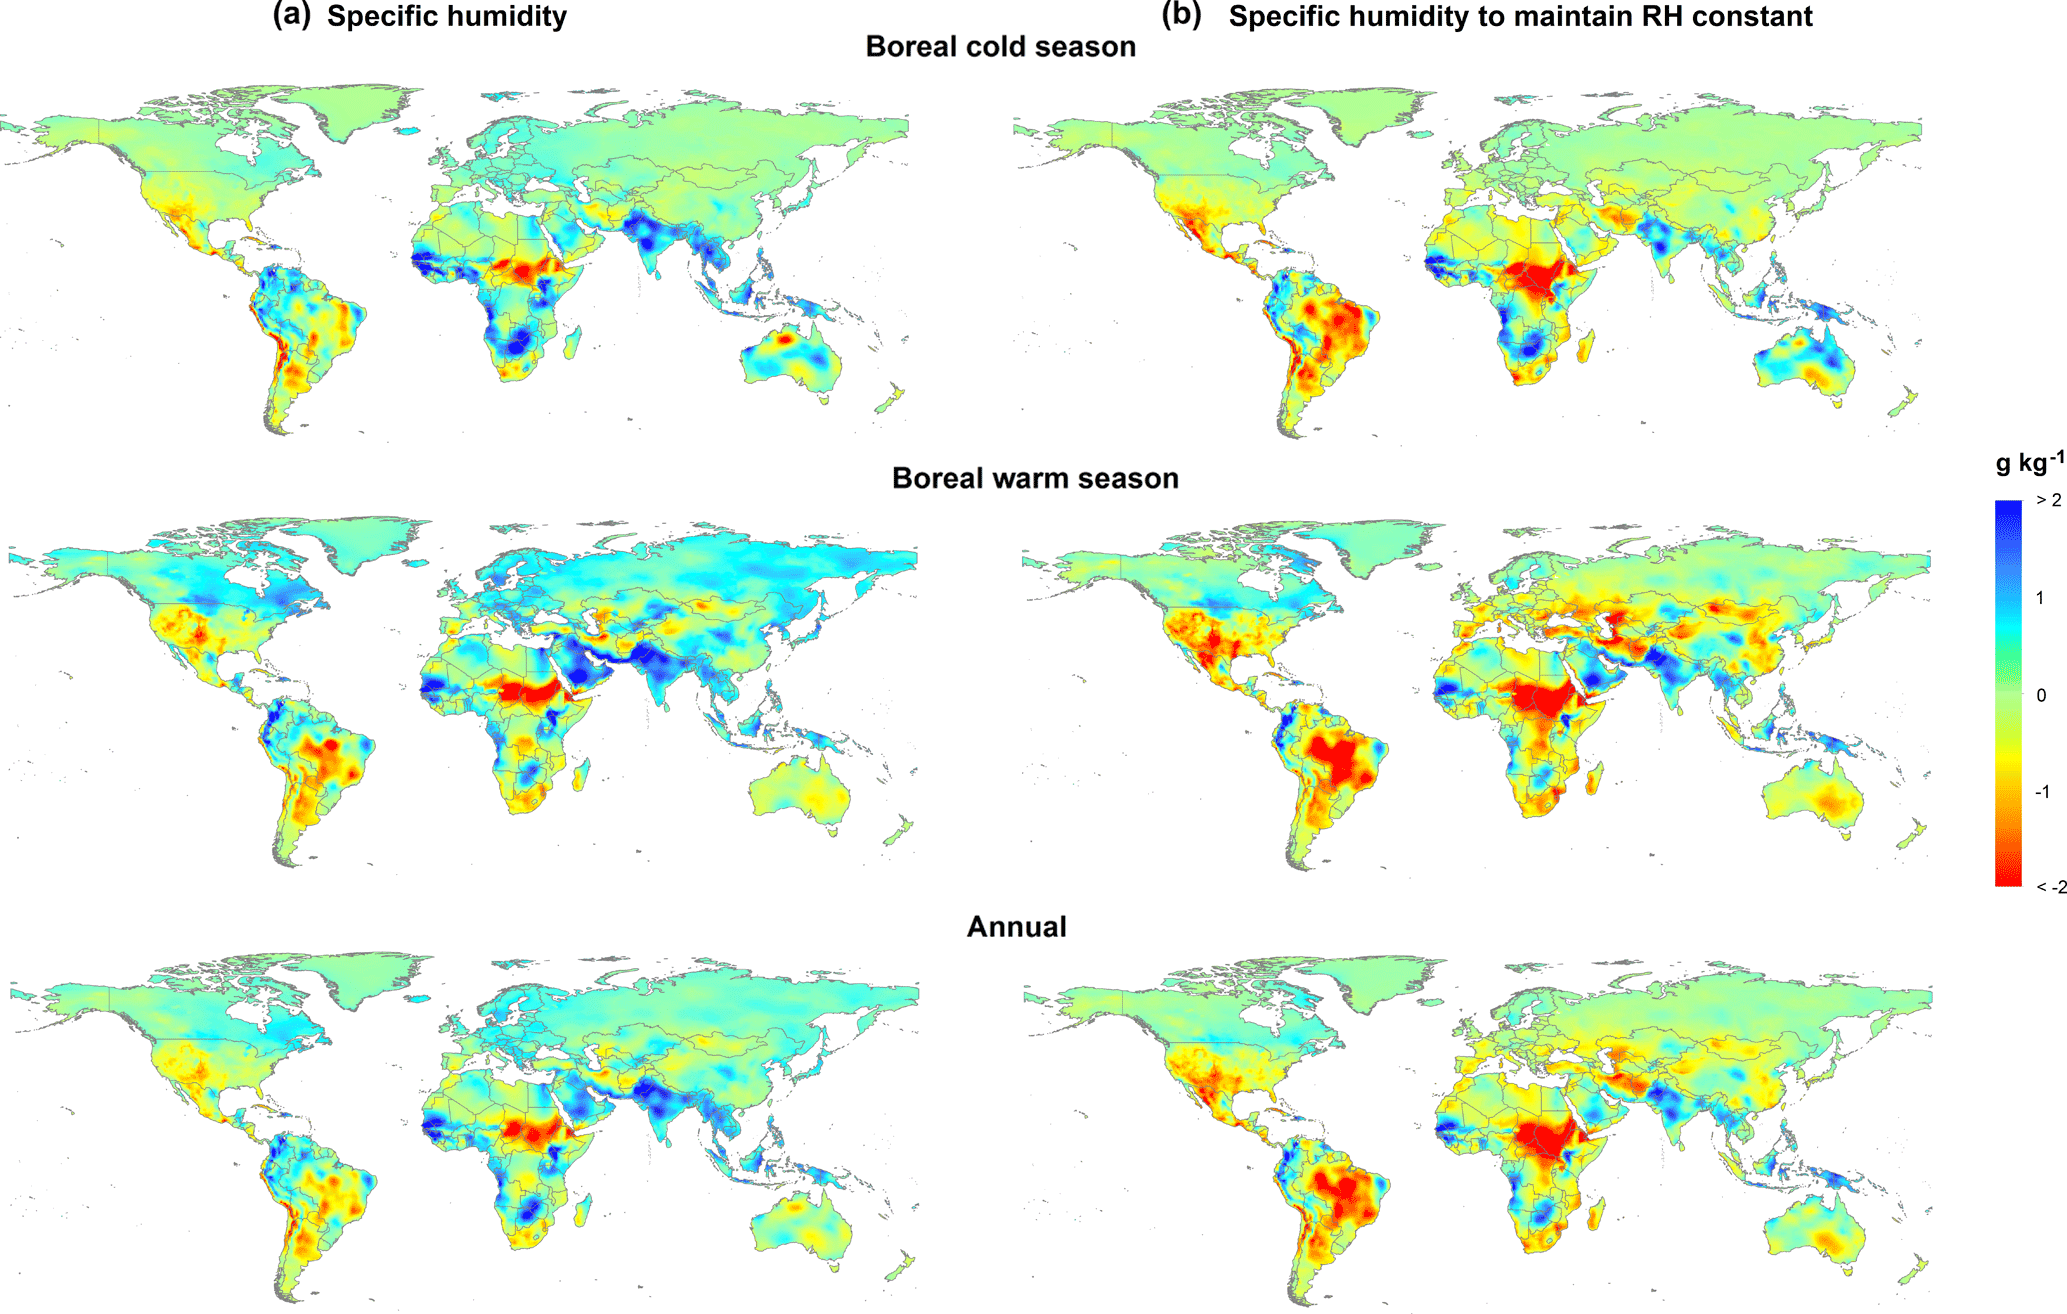
Figure 3Spatial distribution of the seasonal and annual magnitudes of change in specific humidity (g kg1) (a) and the deficit/surplus of specific humidity to maintain constant RH at the levels of 1979 (b) according to land air temperature evolution (from the CRU TS v.3.23 dataset) for 1979–2014.
For each target region, we related the regional series of seasonal and annual RH to the corresponding regional time series of all aforementioned climatic variables. However, to limit the possible influence of the trends presented in the data itself on the computed correlations, we de-trended the series of the climate variables prior to calculating the correlation. We also assessed changes in the regional series of the different variables; their statistical significance was tested by means of the modified Mann–Kendall test at the 95 % level. For each target region, we summarized the results of the magnitude of change in RH as well as other investigated variables at the seasonal and annual scales. However, to facilitate the comparison among the different variables and the target regions worldwide, we transformed the amount of change of each variable to percentages.
Finally, we also computed the association between RH and land evapotranspiration at the annual and seasonal scales using the available gridded evapotranspiration series. While a pixel-to-pixel comparison does not produce a reliable assessment of the possible contribution of land evapotranspiration to RH changes, given that the source of moisture can apparently be far from the target region, we still believe that this association can give insights into the possible relationship between land evapotranspiration and RH changes.
3.1 Trends in relative humidity
There are regional differences where the precipitation dominates (negative values) over the evaporation (positive values), from the ERA-Interim dataset (Supplement Fig. S1). Figure 1 summarizes the magnitude of change in RH for the boreal cold and warm seasons and at the annual scale for the period between 1979 and 2014. For HadISDH, it is noted that the available RH stations are unevenly distributed over the globe, with higher density in the midlatitudes of the Northern Hemisphere. Nevertheless, the available stations show coherent and homogeneous spatial patterns of RH changes (Fig. S2). The ERA-Interim dataset showed magnitudes of change close to those suggested by HadISDH. In addition, the ERA-Interim also provides information on RH changes in regions with low density of RH observations (e.g., eastern Amazonia, eastern Sahel, and Iran), suggesting a dominant RH decrease across these regions. For the boreal warm season, a clear tendency towards a reduction in RH was observed in vast regions of the world, including (mostly the Iberian Peninsula, France, Italy, Turkey, and Morocco) eastern Europe and the western part of Russia. This reduction was also noted in South America, with a general homogeneous pattern over Peru and Bolivia and a strong decrease over central Argentina. Conversely, the positive evolution of RH observed during the cold season across Canada and Scandinavia was reinforced during the boreal warm season. ERA-Interim also revealed a strong RH decrease over the whole Amazonian region and the western Sahel. A wide range of these regions exhibited statistically significant trends from 1979 to 2014 (Fig. S3).
With these complex spatial patterns of RH changes, there is a global dominant negative trend (Fig. 2). This pattern was observed using both the HadISDH and the ERA-Interim datasets, although there is marked spatial bias in data availability of the HadISDH. The relationships among the magnitudes of change in RH, as suggested by the HadISDH dataset versus the ERA-Interim dataset, show a relatively high correlation (mostly above 0.55). Given this high consistency between the HadISDH and the ERA-Interim datasets in terms of both the magnitude and sign of change in RH and also in the interannual variations (Figs. S4–S6), we decided to restrict our subsequent analysis to the ERA-Interim dataset, recalling its denser global coverage compared to the HadISDH.
As RH is mostly dependent on changes in specific humidity (q), there is a dominant high correlation between the interannual variability in RH and q (Fig. S7). In accordance, the magnitude of observed change in these two variables showed a strong agreement for 1979–2014. Figure 3 summarizes the magnitude of change in specific humidity (q) as well as changes in specific humidity necessary to maintain constant RH as recorded in 1979. Specific humidity showed the strongest decrease in southwestern North America, the Amazonian region, southern South America, and the Sahel regions: a spatial pattern that is similar to the RH pattern. Given the evolution of air temperature for 1979–2014, these regions exhibited a deficit of water vapor on the order of −2 g kg−1 in order to maintain constant RH.
3.2 Spatial patterns of the dependency between RH and climate variables
We selected a range of regions (N= 14) worldwide (Fig. 4). For these selected regions, we assessed the connection between RH and some relevant climatic variables for the period 1979–2014. In addition, we defined the oceanic and continental sources of moisture corresponding to these regions using the FLEXPART model. We assessed the optimal lifetime for each region: during 4 days for regions 1–5 and 7–11, during 5 days for regions 6 and 12–13, and during 7 days for region 5. Figures 7–9 show some examples of the dependency between RH and different climate variables at the annual scale. Results for all regions at the seasonal and annual scales are presented in the Supplement.
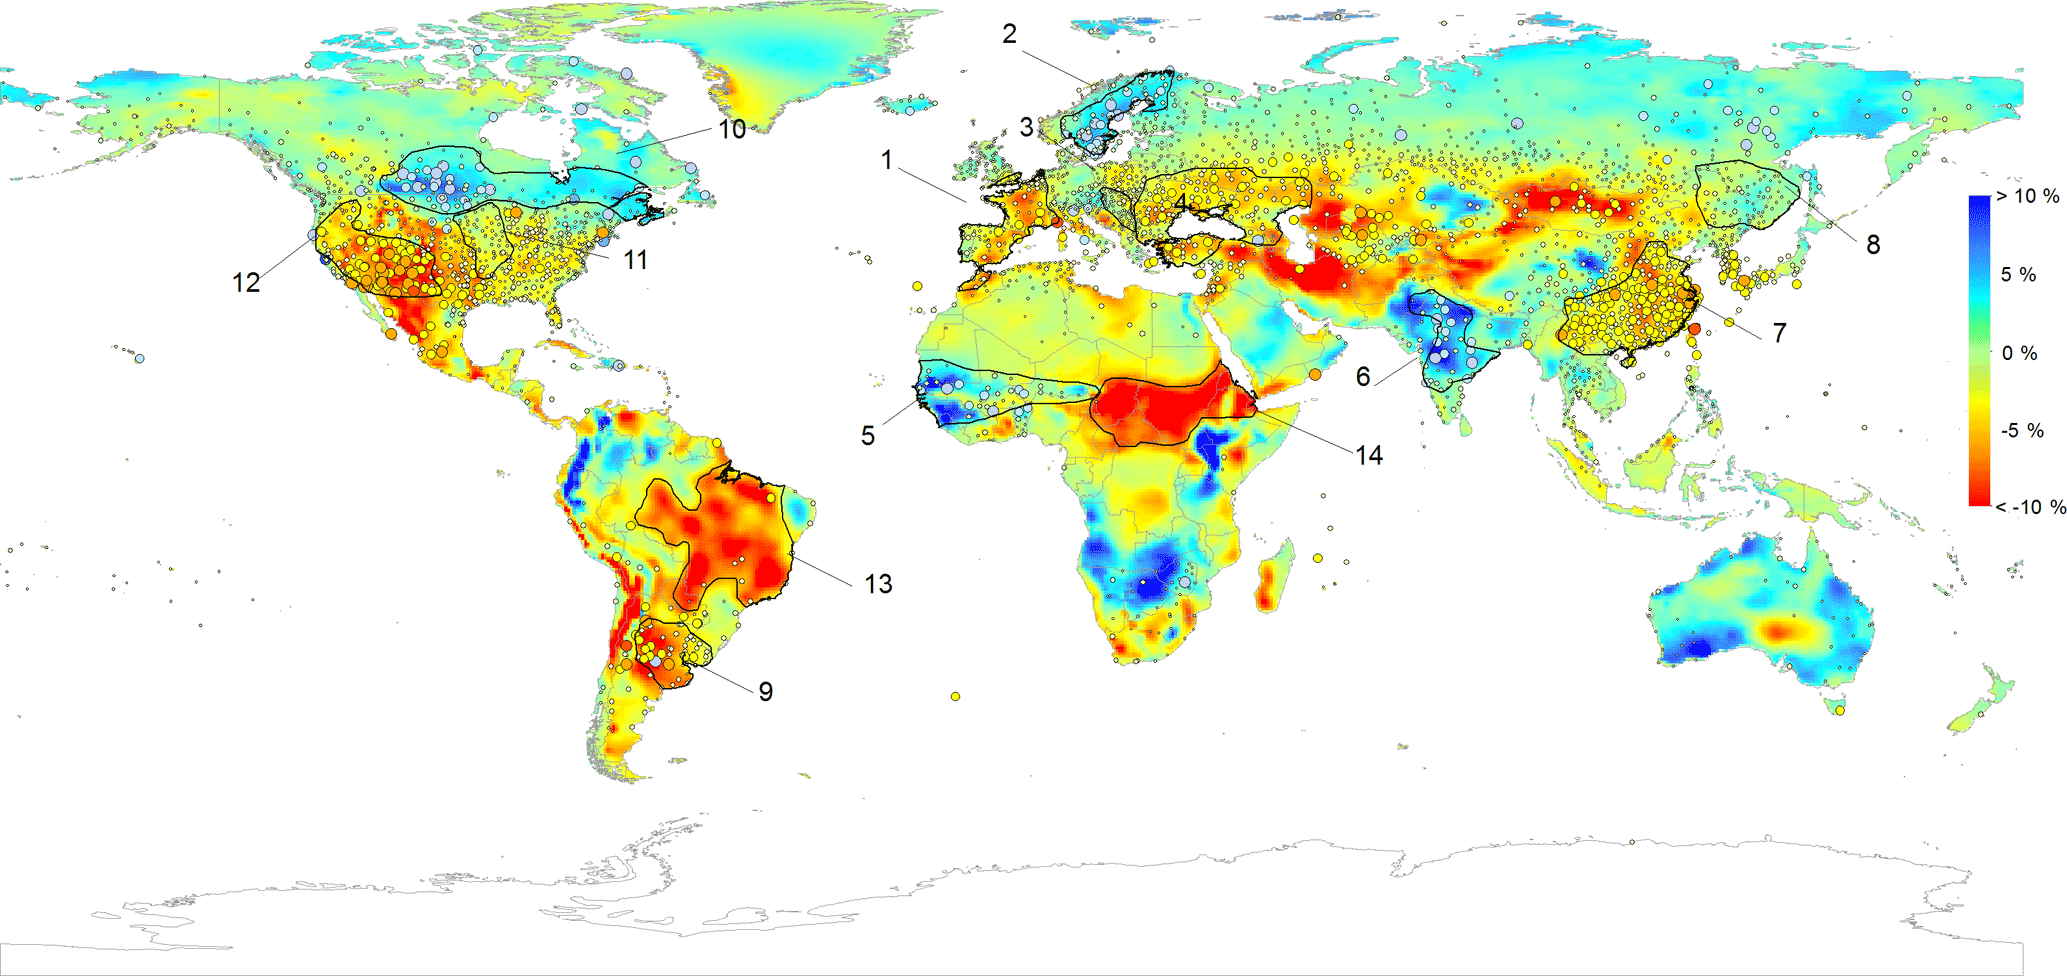
Figure 4Spatial distribution of the selected 14 world regions, based on the high consistency in RH trends between the HadISDH and the ERA-Interim datasets. These regions were selected for the identification of the oceanic and land humidity sources by means of the FLEXPART scheme.
3.2.1 Western Sahel
Figure 5a, b illustrate RH trends in the western Sahel using the HadISDH and ERA-Interim datasets. We also showed the distribution of the average annual moisture sources (E–P in millimeters) over this region for 1979–2014. As illustrated, the atmospheric moisture mostly comes from the western Sahel region itself, in addition to some oceanic sources located in the central eastern Atlantic Ocean. At the seasonal scale, there are some differences in the location and the intensity of the moisture sources, with more oceanic contribution during the boreal warm season. However, in both cases, the continental moisture seems to be the key source of humidity in the region (Figs. S23 and S37). Figure 5c shows different scatter plots summarizing the relationships between the de-trended annual series of RH and those of relevant climate variables (e.g., precipitation, air temperature, and SST). The interannual variability in RH in the region is correlated to changes in the total annual precipitation and the total annual land evapotranspiration in the continental source region. Specifically, the correlation between the de-trended annual RH and precipitation and land evapotranspiration is generally above 0.8 (p < 0.05). In contrast, RH shows negative correlations with air temperature and SST ratio over the oceanic source. While the correlation is statistically insignificant (p > 0.05), it suggests that higher differences between air temperature and SST reinforce lower annual RH. At the seasonal scale, we found similar patterns (Figs. S23 and S37). Nevertheless, in the warm season, a significant negative correlation with air temperature and SST ratio was observed. This pattern concurs with the significant increase in specific humidity (q) for 1979–2014; this is probably related to the high increase in land evapotranspiration (19.5 %, p < 0.05).
3.2.2 La Plata region
Figure 6 summarizes the corresponding results, but for the La Plata region (South America). Results indicate a general decrease in RH at the annual and seasonal scales using both the HadISDH observational data and the ERA-Interim dataset. As depicted, the main humidity sources are located in the same region, combined with some other neighboring continental areas over South America. A similar finding was also observed on the seasonal scale (Figs. S27 and S41). Similar to the western Sahel region, we found a significant association between the interannual variations in RH and precipitation and the land evapotranspiration in the continental source region. Similarly, we did not find any significant correlation between RH changes and the interannual variability in the oceanic evaporation in the oceanic source region or the ratio between air temperature in the continental target region and SST in the oceanic source region. Again, we found a negative correlation between RH and the air temperature ∕ SST ratio, though it is statistically insignificant at the annual scale (p > 0.05). In the La Plata region, we noted a strong decrease in RH (−6.21 % decade−1) for 1979–2014, which agrees well with the strong decrease in absolute humidity.
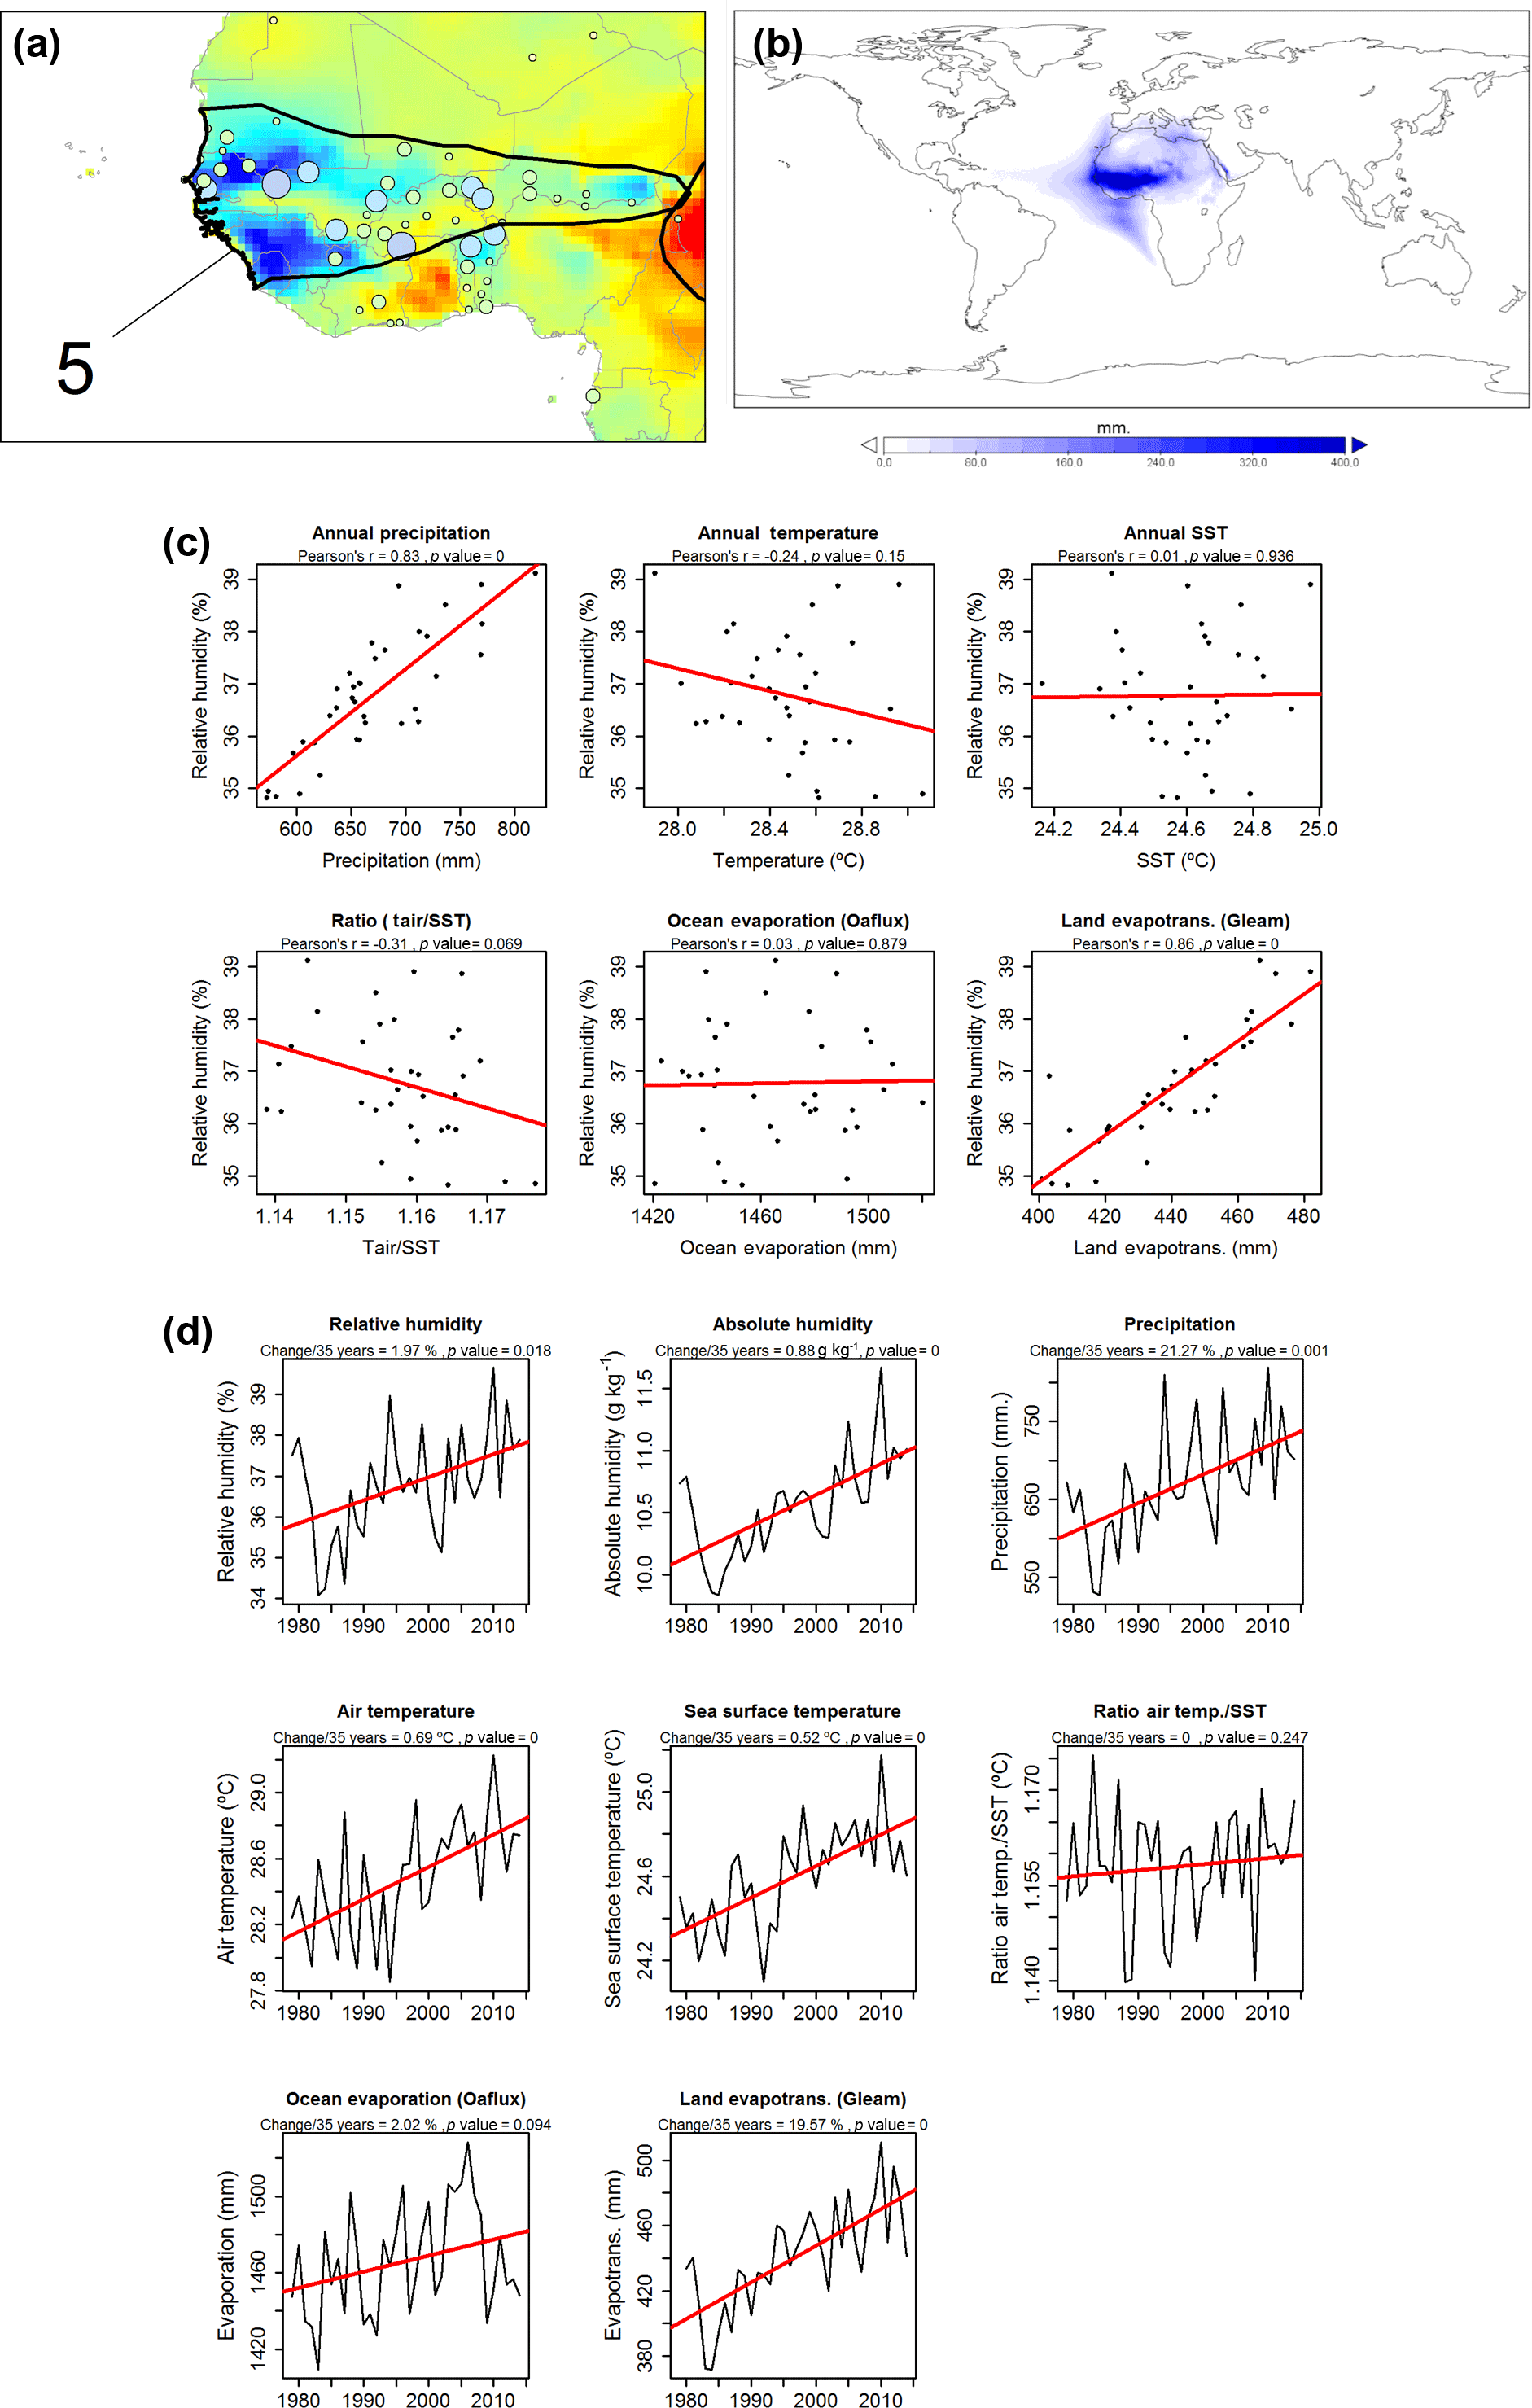
Figure 5(a) Annual RH humidity trends in the western Sahel (region 6); (b) average (E–P) > 0 at the annual scale to identify the main humidity sources in the region (mm yr−1). (c) Relationships between the de-trended annual RH and the de-trended annual variables for 1979–2014. (d) Annual evolution of the different variables corresponding to the western Sahel region. The magnitude of change and their corresponding statistical significance are indicated for each variable.
3.2.3 Southwestern North America
Results for southwestern North America are also illustrated in Fig. 7. In accordance with both previously studied examples (western Sahel and La Plata), this region also exhibited a strong and positive relationship between the interannual variability in RH and precipitation and land evapotranspiration. This pattern was also recorded for the boreal warm and cold seasons (Figs. S30 and S43). In this region, we found a strong negative trend in RH for 1979–2014, which concurs with the significant decrease in absolute humidity. We noted a significant increase in air temperature and air temperature-to-SST ratio, while a negative and statistically significant decrease in land evapotranspiration in the continental sources of moisture was observed.
3.2.4 Other regions
Other regions of the world (see Supplement) also showed strong dependency between the interannual variability in RH and that of land evapotranspiration in the land moisture sources. Some examples include western Europe, central–eastern Europe, southeastern Europe, Turkey, India, and the eastern Sahel. In contrast, other regions showed a weak correlation between the temporal variability in RH and land evapotranspiration in the moisture source region. A representative example is China, which witnessed a strong decrease in RH for 1979–2014. Nevertheless, the air temperature ∕ SST ratio in the oceanic moisture sources also exhibited negative correlations with RH in particular regions, including the western Sahel, La Plata, the west coast of the USA, central–eastern Europe, India, central North America, and the Amazonian region. This finding suggests that higher differences between air temperature in the target area and SST in the oceanic moisture region would favor decreased RH.
3.3 Land and ocean contribution to RH trends
Establishing a direct influence of land evapotranspiration on RH is a challenging task, also including any attempt to directly compare these influences with the possible contribution from oceanic evaporation and moisture transport. This is primarily because, apart from very humid regions, the increase in land evapotranspiration could be driven by increased precipitation, which is accompanied by anomalous RH conditions. This dependency explains the correlation found between precipitation and land evapotranspiration in some regions worldwide (Figs. S47 to S49). In cold and humid regions, land evapotranspiration is also related to the interannual variability in the AED (Figs. S50 to S52). Correspondingly, the magnitude of the oceanic evaporation may be insufficient to explain RH anomalies in the target region.
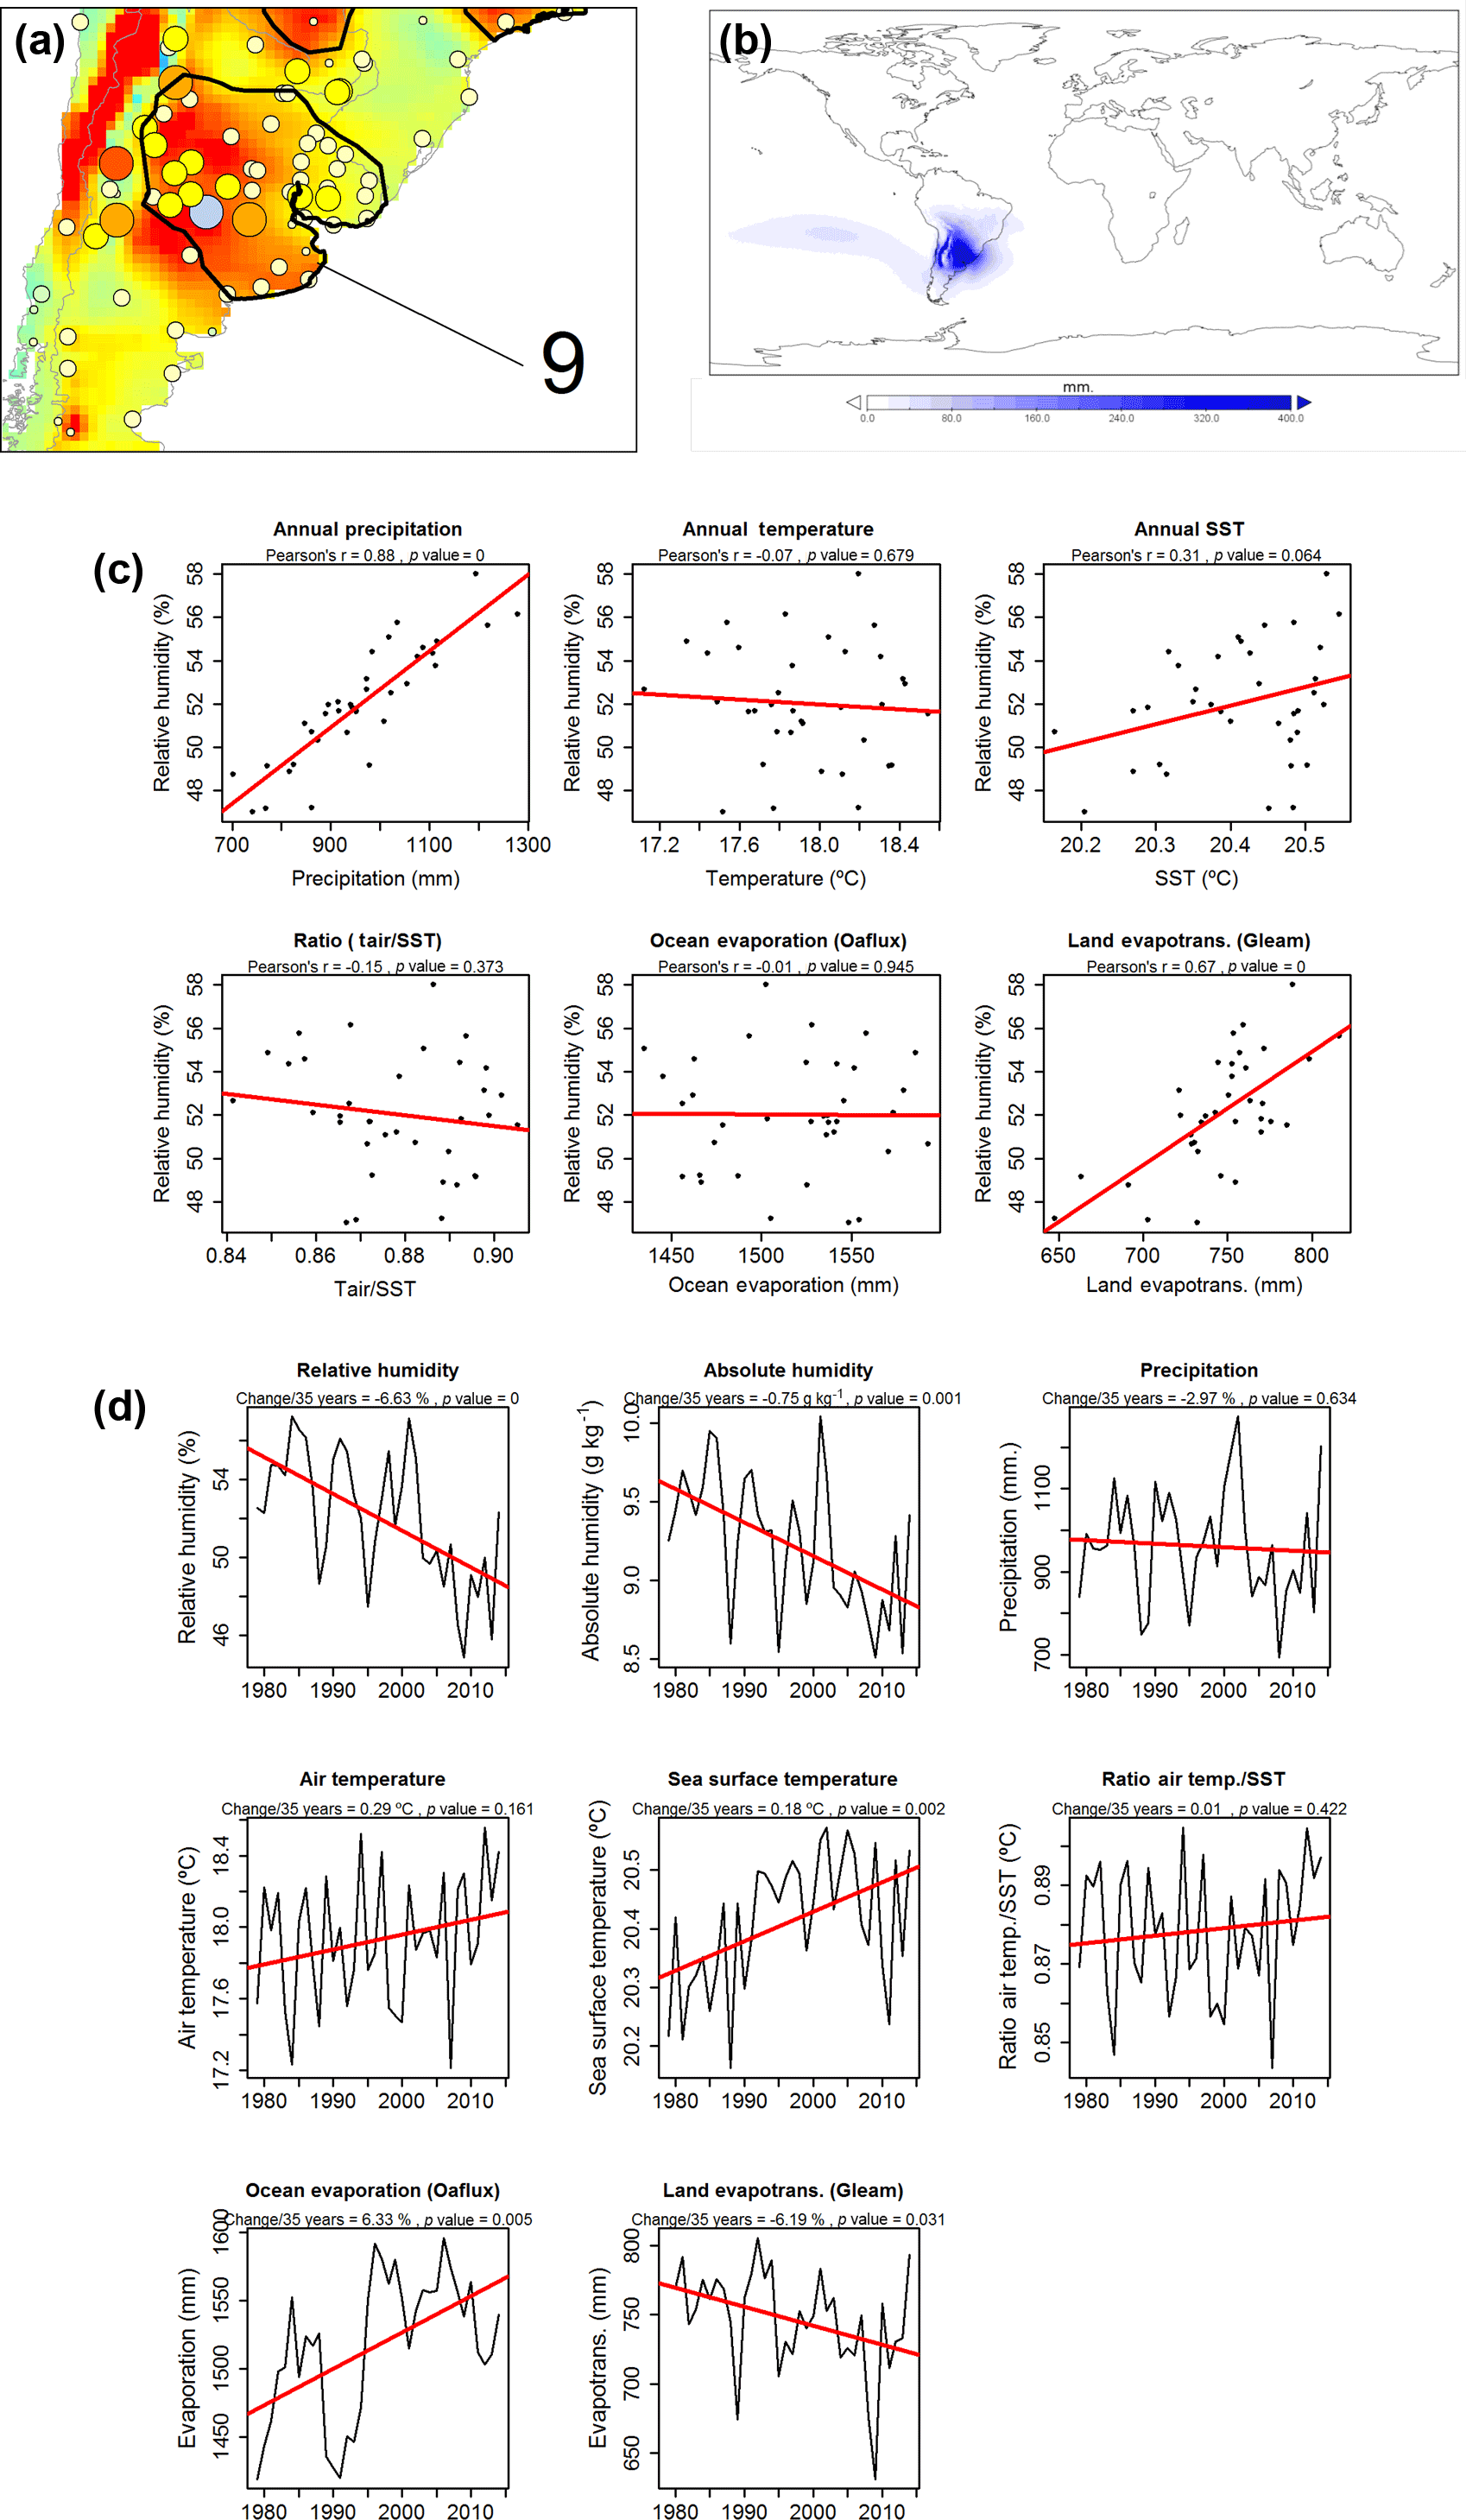
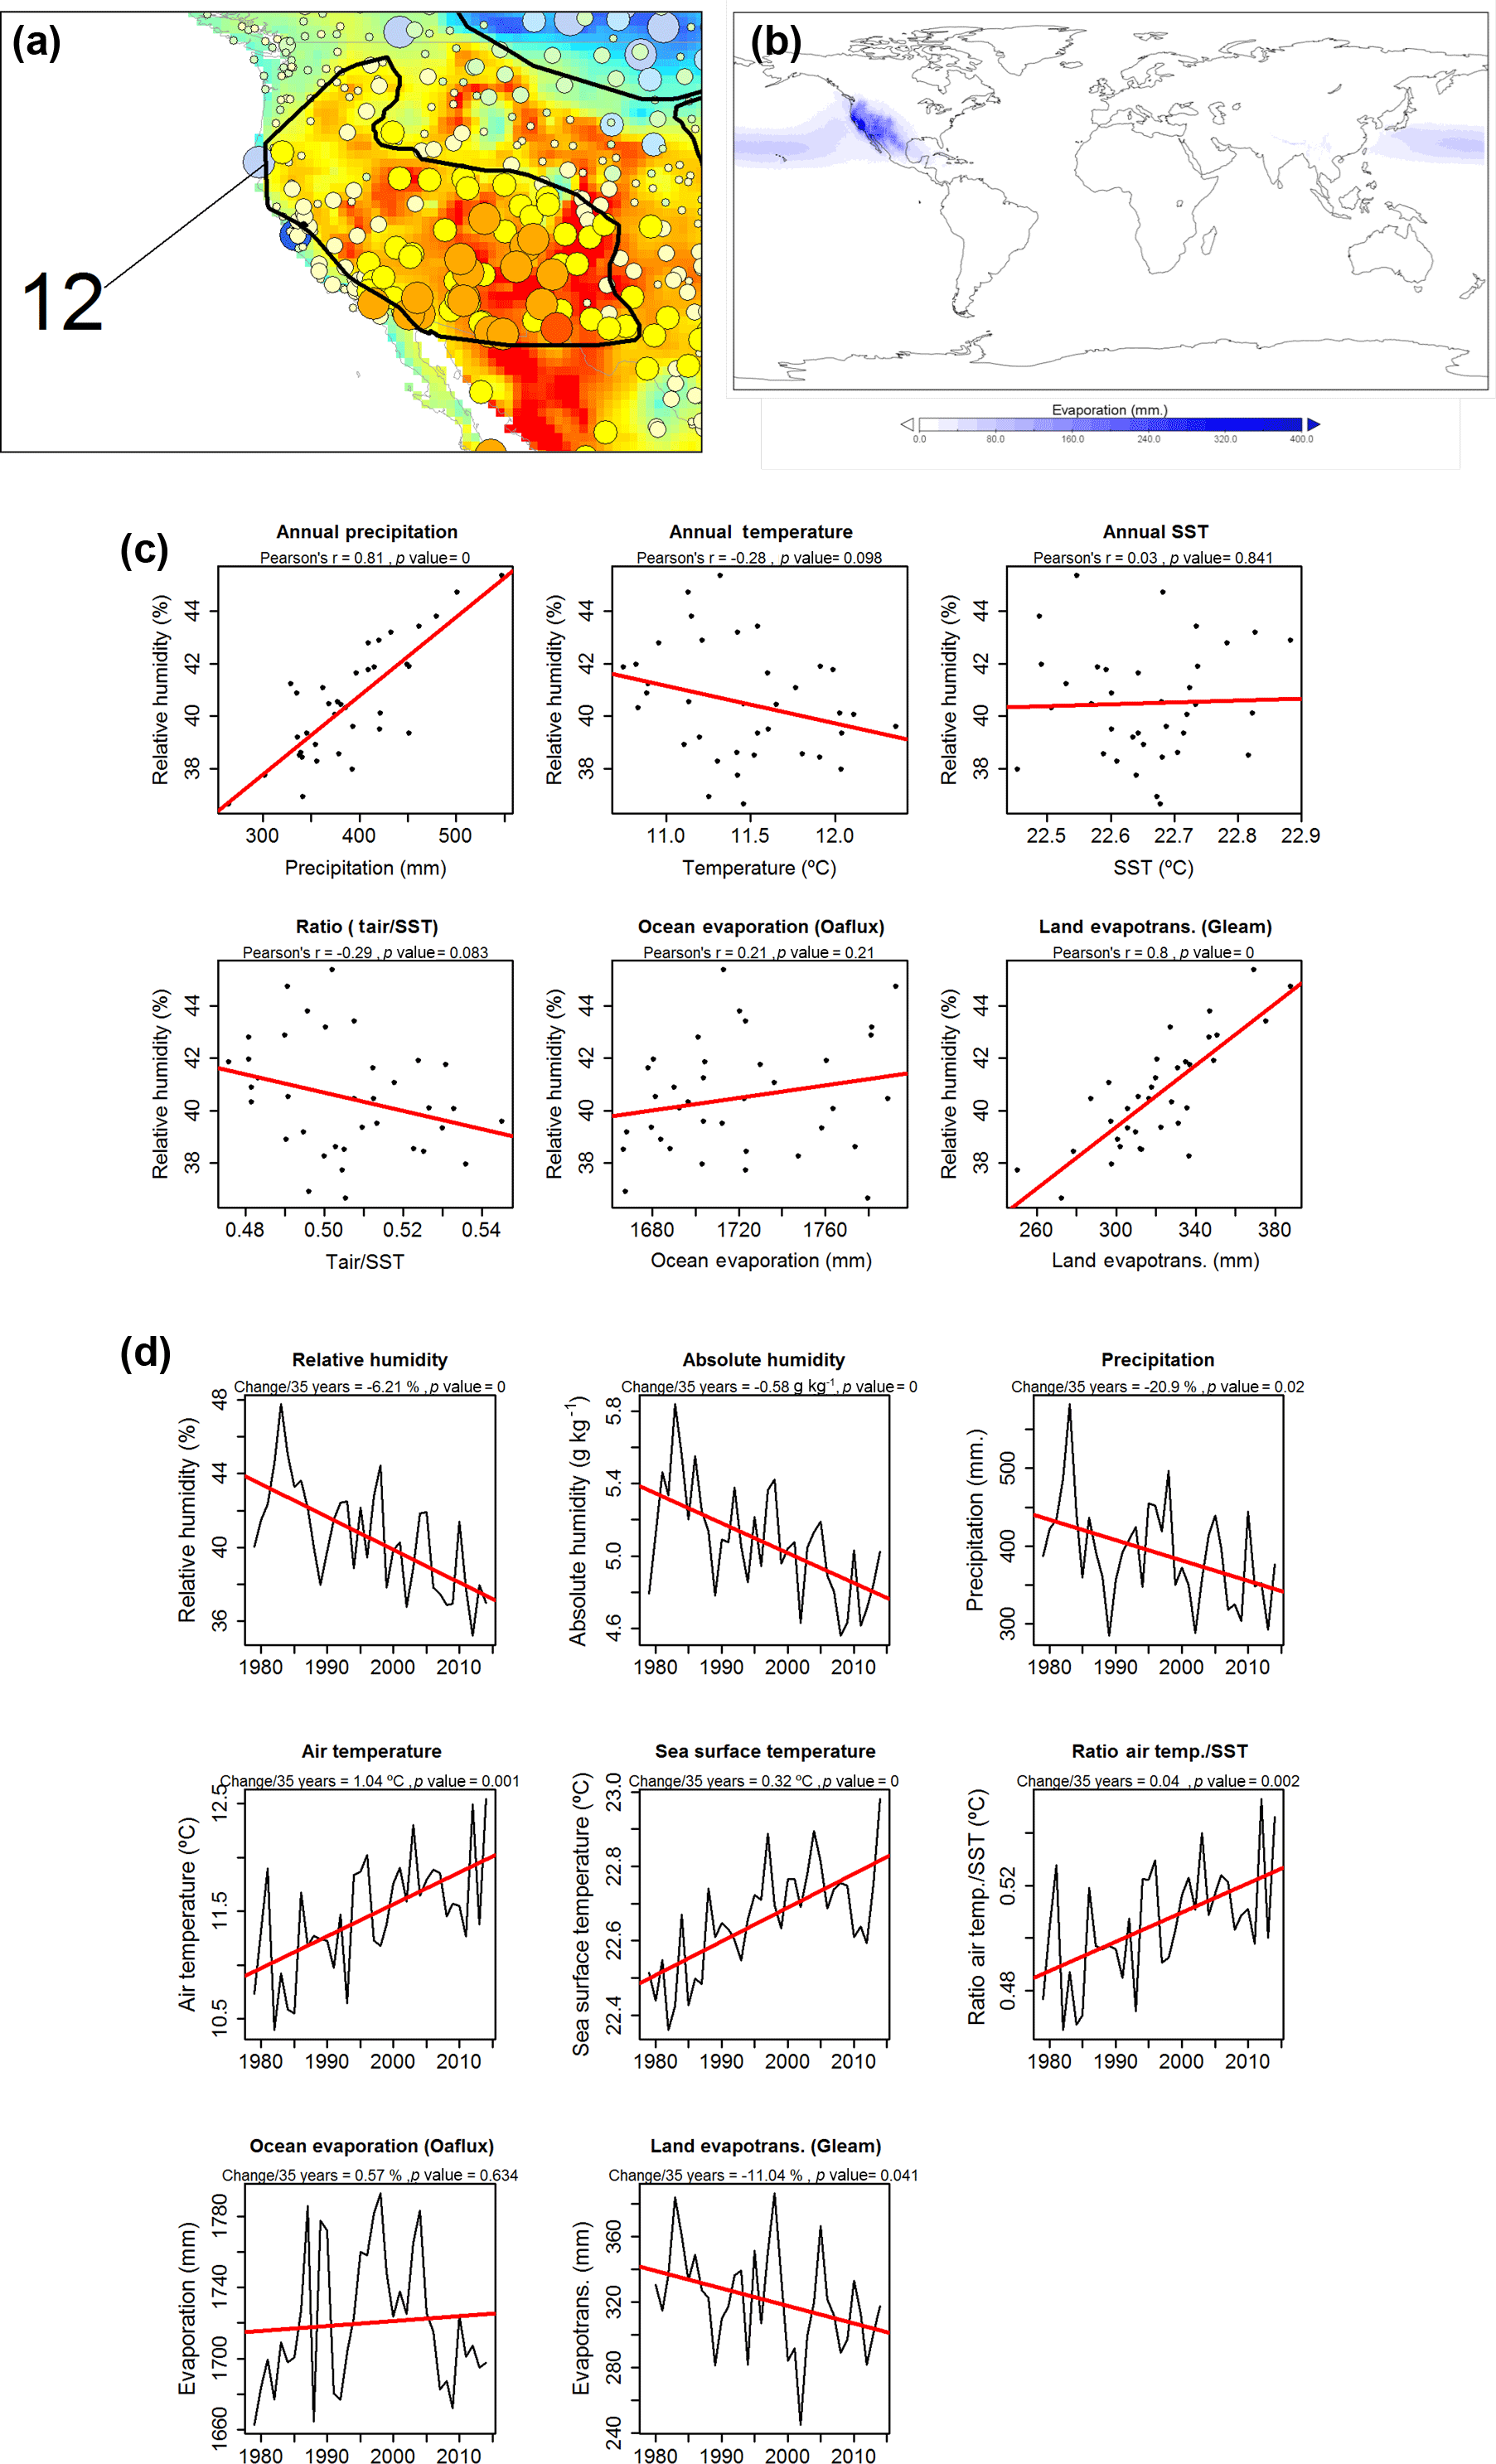
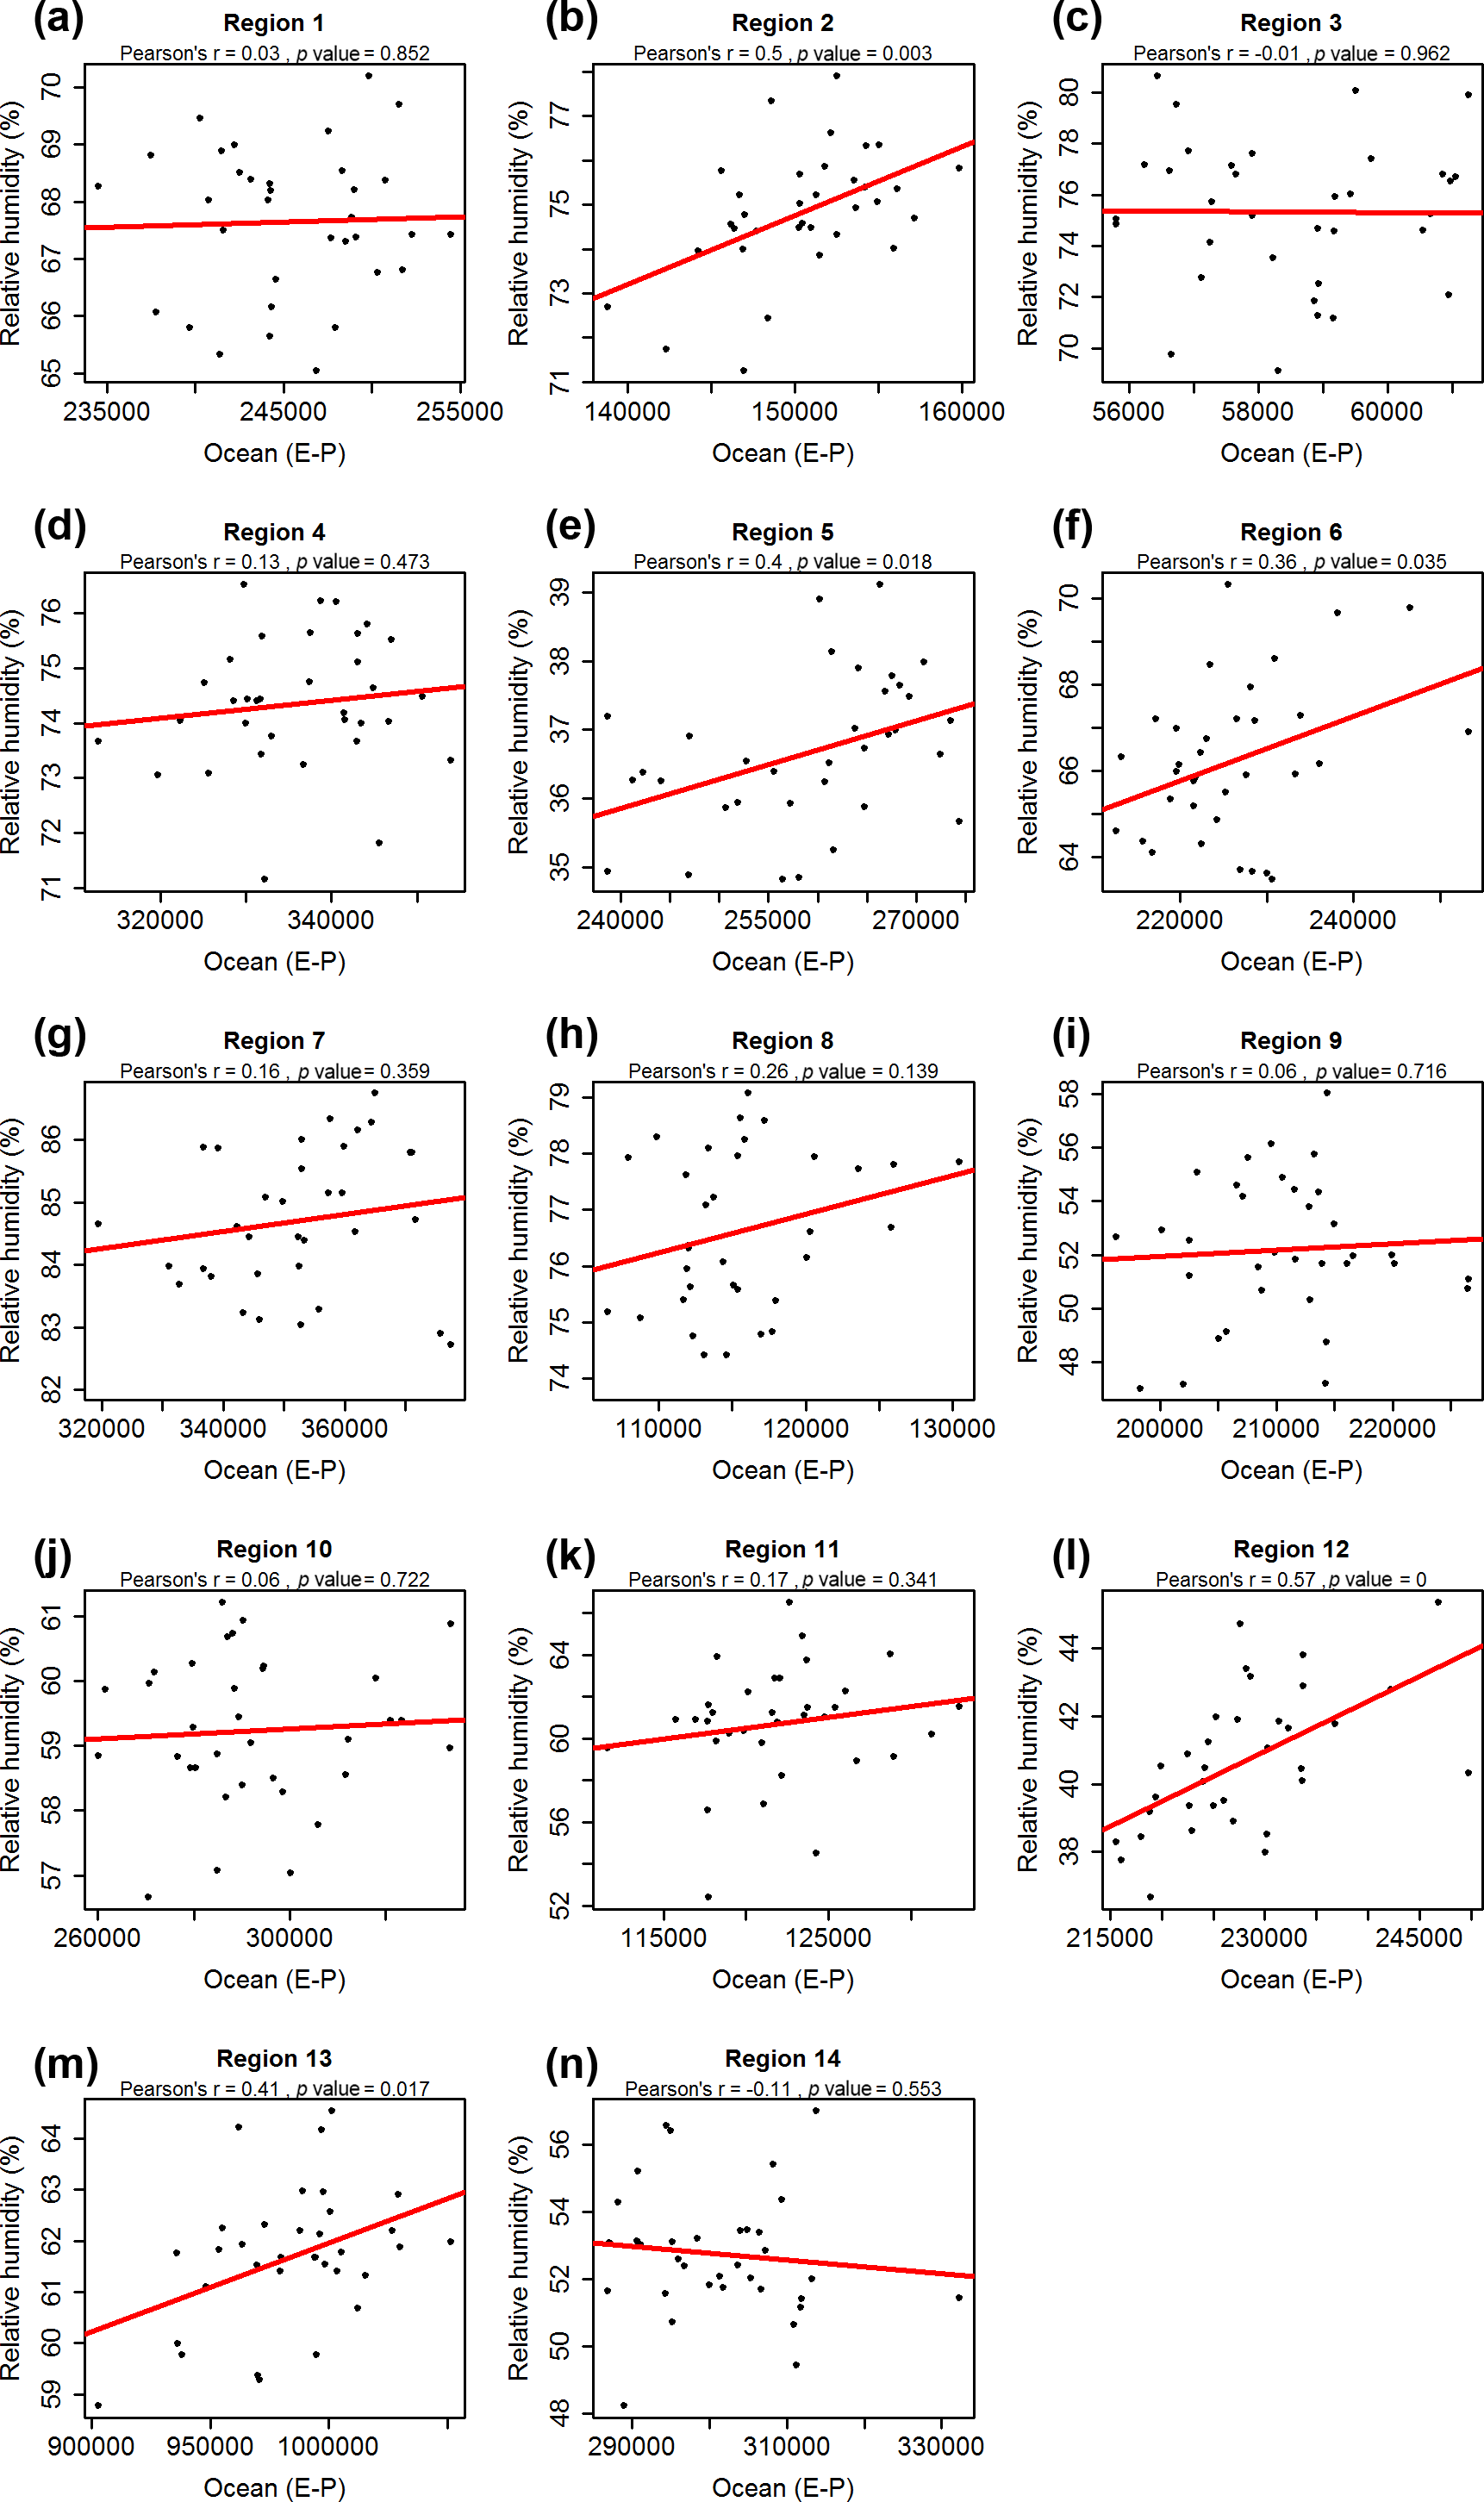
Figure 8Relationships between the annual oceanic contribution to annual precipitation (E–P) and the annual RH in the target regions.

Figure 9Relationships between the annual land contribution to annual precipitation (E–P) and the annual RH in the target regions.

Figure 10Evolution of the land contribution to annual precipitation (%) in the different target regions.
Taken together, the transport of moisture to any target region is a fundamental process. Hence, we assessed the contribution of land and ocean to precipitation, as represented by (E–P). Overall, results reveal important differences among the analyzed regions, with statistically insignificant correlations found between the interannual variations in RH in some regions and ocean and land contribution to precipitation (Figs. 8 and 9). A similar pattern was observed at the seasonal scale, albeit with greater contribution during the cold season, especially in the regions where precipitation is mostly driven by western flows (e.g., western North America, western Europe, and Scandinavia) (Figs. S53–S56). Conversely, the land contribution to precipitation is rather complex, with strong spatial differences. At the annual scale, a positive and significant contribution to precipitation (E–P) is found in regions 3 (central–eastern Europe), 6 (India), 7 (China), 9 (La Plata), and 11 (central US). This suggests that there are no generalized patterns in terms of the contribution of ocean and land to the interannual variability in RH, making it difficult to attribute RH trends to a unique driver.
Figure 10 illustrates the evolution of the land contribution (E–P) to precipitation in the different target regions. We noted positive and significant changes in regions 2 (Scandinavia), 3 (central–eastern Europe), 5 (western Sahel), and 14 (eastern Sahel). A contradictory behavior is observed for region 9 (La Plata), with a statistically significant downward trend in land contribution (E–P) to precipitation. At the seasonal scale, results suggest considerable differences (Figs. S57 and S58), with no clear positive or negative trends.
Changes in RH were more associated with those of land evapotranspiration across the selected regions (Fig. 11). In contrast, changes in annual RH did not correlate significantly with the observed changes in precipitation, air temperature–SST, and oceanic evaporation. The observed patterns were similar for both the warm and the cold seasons (Figs. S59 and S60). These positive and significant correlations do not imply causation between land evapotranspiration and RH variations over space and time. Nevertheless, these findings suggest a role of land evapotranspiration in explaining the observed RH trends. Specifically, for many regions and at different temporal scales (i.e., seasonal and annual), changes in land contribution to precipitation show statistically significant positive correlation with changes in evapotranspiration and precipitation (Fig. S61). Again, this correlation does not imply a true causal relationship between RH variability and evapotranspiration, given the strong coupling between many of these controlling variables (e.g., precipitation, RH, and land evapotranspiration). The agreement between changes in the land contribution to precipitation and changes in land evapotranspiration, but also the fact that in many regions land contribution (E–P) to precipitation is important (contributions close to 50 % or even higher; Table S1 in the Supplement), suggests the possible role of land evapotranspiration in explaining the spatial patterns of RH changes. Nevertheless, there is some uncertainty in this attribution since the good spatial agreement between RH, precipitation, and land evapotranspiration makes it difficult to accurately define the most dominant variable(s) that control the temporal variability in RH (Figs. S62–S64).
The complex spatial trends for different variables add another source of uncertainty to proper attribution of RH changes. Figure 12 illustrates the spatial distribution of the magnitude of change in annual and seasonal land evapotranspiration at the global scale from 1979 to 2014. As depicted, the spatial patterns of land evapotranspiration changes resemble those of RH in some regions (refer to Fig. 1), including – for example – the Canadian region, southwestern North America, and the western and eastern Sahel. Nevertheless, other regions showed a divergent pattern between both variables (e.g., the Guinea Gulf in Nigeria and Cameroon), where we noted a strong increase in land evapotranspiration, as opposed to RH changes. The Eurasian continent showed the main divergences between both variables. For example, in the western Europe, we noted a dominant RH decrease, which was not observed for land evapotranspiration. A similar pattern was observed over eastern China, with a dominant RH negative trend and a positive land evapotranspiration. Overall, the lack of significant spatial association between the magnitude of trends in RH and the magnitude of trends in evapotranspiration can be seen in the context of the strong spatial diversity of trends in these two variables at both annual and seasonal scales (Fig. S65). This complexity is similar to that found for trends in precipitation (Fig. S66). Thus, results suggest that while the variability in precipitation, RH, and land evapotranspiration show strong interannual associations, their observed trends are completely decoupled over space. This high spatial variability in trends at the global scale confirms that direct attribution of observed RH changes to land contributions is a challenge and quite a complex task.
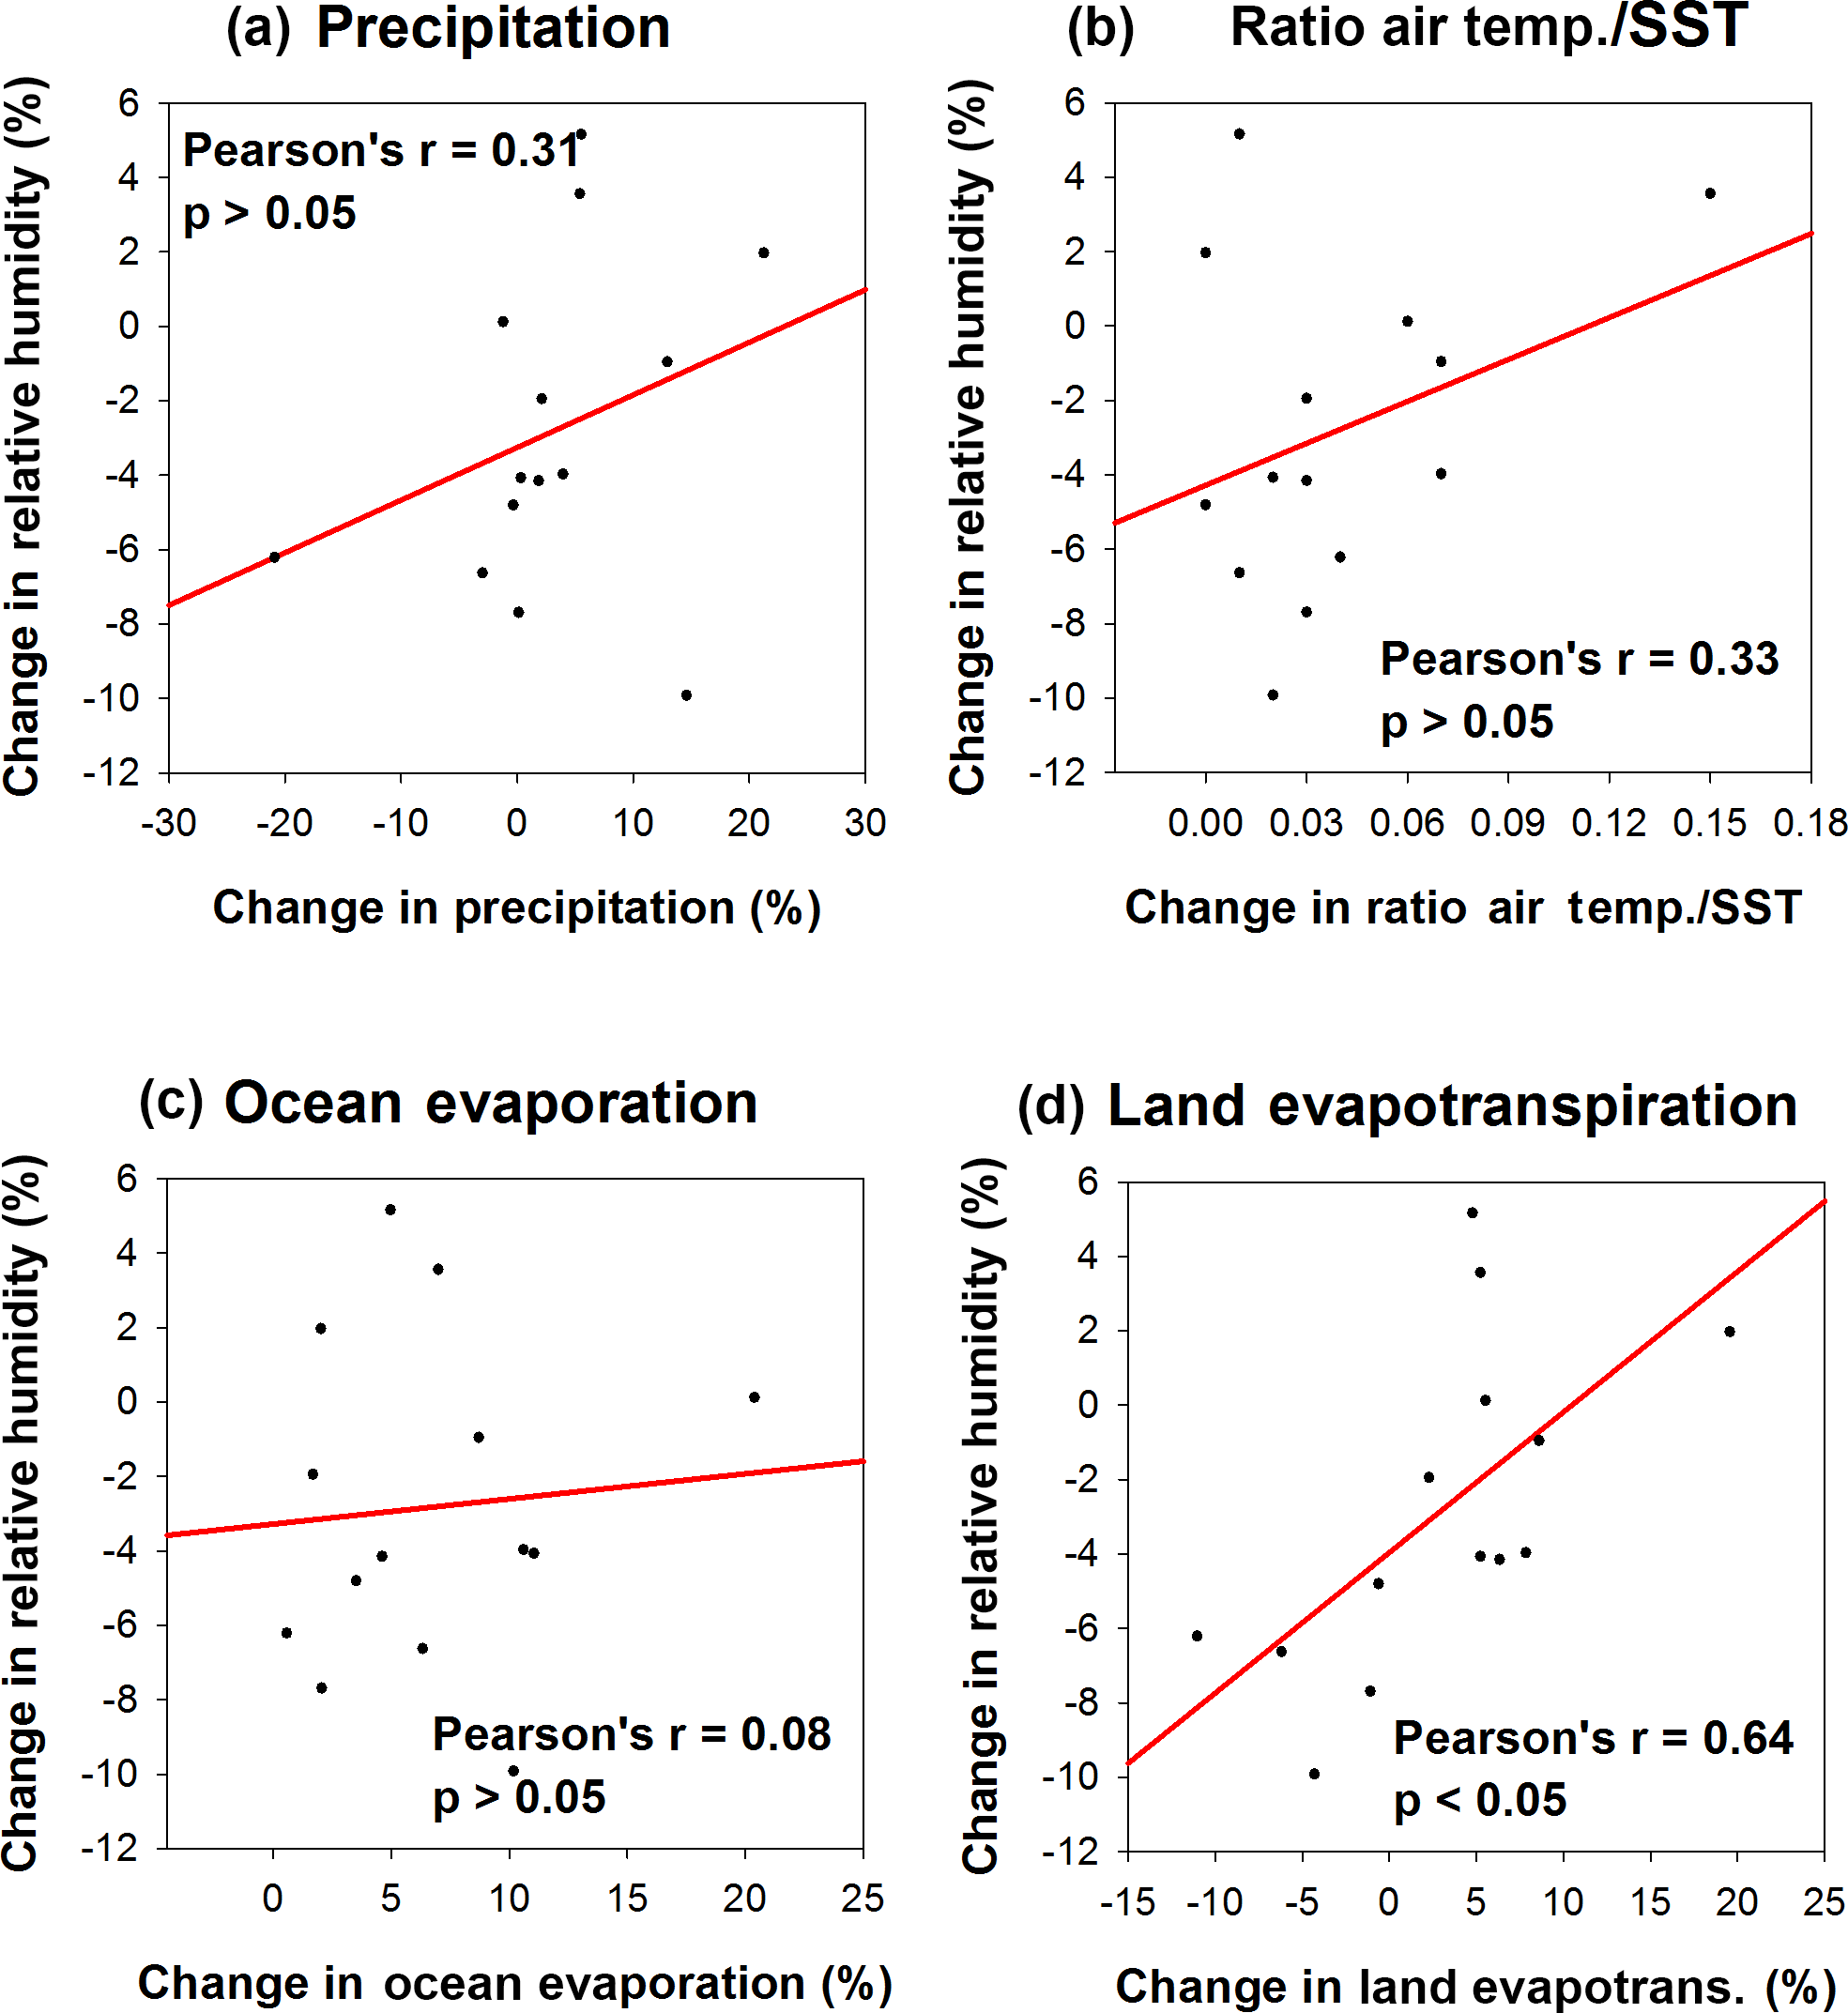
Figure 11Relationships between the average annual magnitudes of change in RH identified for each one of the 14 analyzed regions and the annual magnitudes of change in precipitation, the ratio between air temperature and SST, oceanic evaporation, and land evapotranspiration.
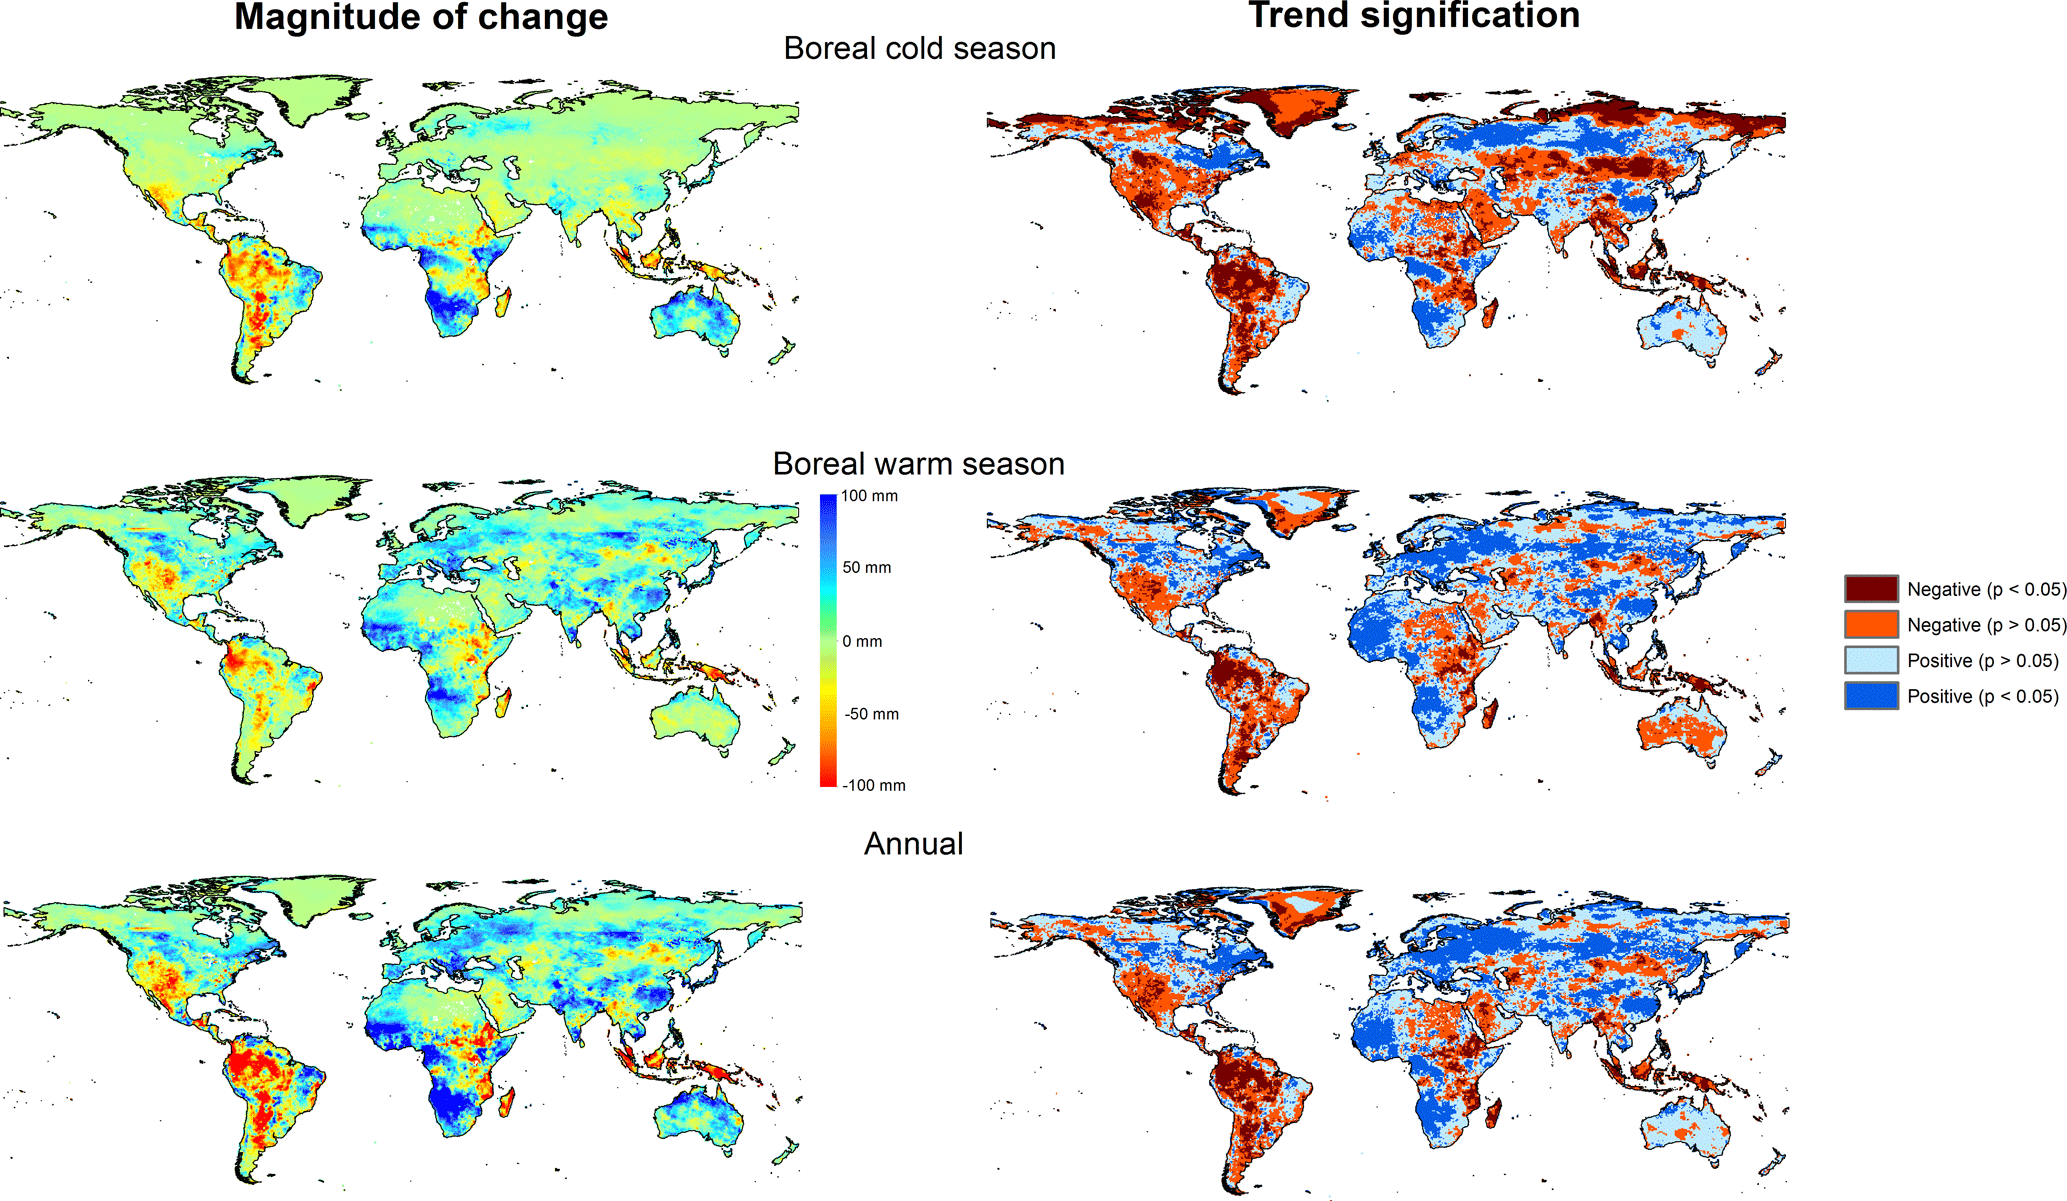
Figure 12Spatial distribution of the magnitude of change in the annual and seasonal land evapotranspiration (1979–2014) and their corresponding statistical significance.
In relation to the ocean evaporation, it is also quite difficult to establish this connection. In particular, it is not feasible to identify the moisture sources and the ocean contribution of the precipitation for each 0.5∘ land pixel at the global scale. However, we believe that the analysis of the evolution of SST and oceanic evaporation for 1979–2014 and the evolution of the oceanic contribution to precipitation can give indications on some relevant patterns. Figure 13 illustrates the spatial distribution of the magnitude of change of annual and seasonal SST and oceanic evaporation. Figure S67 shows the spatial distribution of trend significance. As depicted, complex spatial patterns and high variability in the trends were observed, particularly for oceanic evaporation. Furthermore, the spatial distribution of the magnitude of change in annual and seasonal oceanic evaporation was not related to the SST changes (Fig. S68). Thus, although some regions showed positive changes in the oceanic evaporation, the amount of increase was much lower than that found for SST, which suggests that only SST changes do not drive evaporation changes (Fig. S69, Table S2).
4.1 Relative humidity trends
We assessed the temporal variability and trends in RH at the global scale using a dense observational network of meteorological stations (HadISDH) and reanalysis data (ERA-Interim). Results revealed high agreement of the interannual variability in RH using both datasets for 1979–2014. Recent studies have suggested a dominant decrease in observed RH during the last decade (e.g., Simmons et al., 2010; Willet et al., 2014). Our study suggests dominant negative trends of RH using the HadISDH dataset. This decrease is mostly linked to the temporal evolution of RH during the boreal warm season. In accordance with the HadISDH dataset, the ERA-Interim revealed dominant negative RH trends, albeit with a lower percentage of the total land surface compared to the HadISDH dataset. These differences cannot be attributed to the selected datasets, given that both mostly agree on the magnitude and sign of changes in RH.
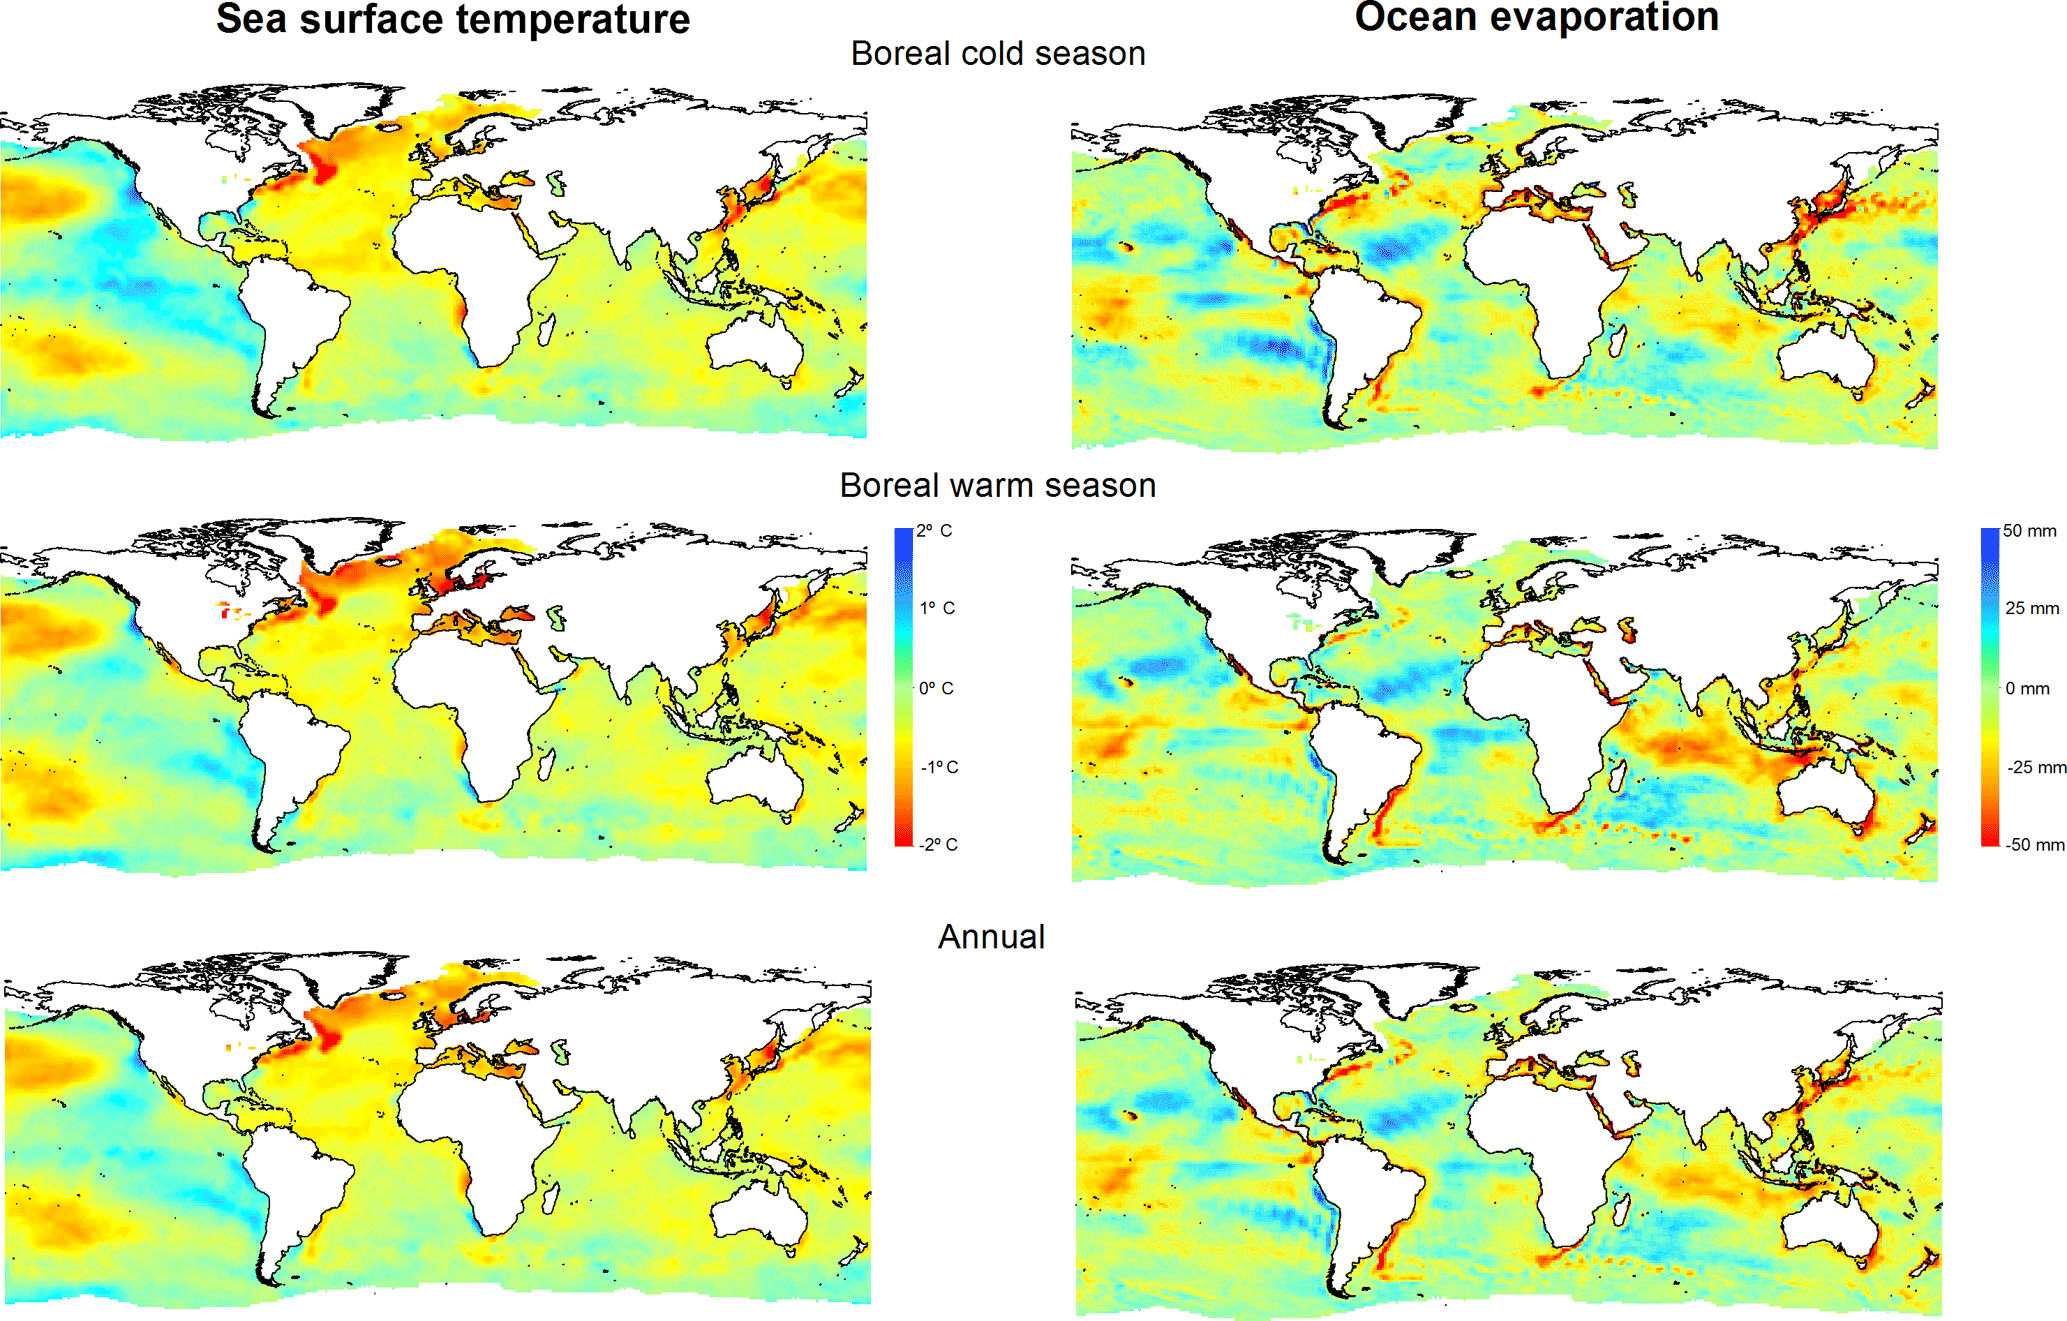
Figure 13Annual and seasonal magnitude of change of SST and OAFlux oceanic evaporation for 1979–2014.
Observed changes in RH were closely related to the magnitude and the spatial patterns of specific humidity changes. Results demonstrate a general deficit of specific humidity to maintain constant RH in large areas of the world, including central and southern North America, the Amazon and La Plata basins in South America, and the eastern Sahel. In other regions, RH increased in accordance with higher specific humidity. Studies suggest that changes in air temperature could partly cancel the effects of the atmospheric humidity to explain RH changes (e.g., McCarthy and Tuomi, 2004; Wright et al., 2010; Sherwood, 2010). Nevertheless, although air temperature trends showed spatial differences at the global scale over the past 4 decades (IPCC, 2013), our results show that air temperature is not the main driver of the observed changes of RH globally. There is a close resemblance between relative and specific humidity trends at the global scale, suggesting that specific humidity is the main driver in the magnitude and spatial pattern of RH trends.
4.2 Contribution of continental areas to changes in RH
Overall, there is an agreement among the interannual variability in precipitation, land evapotranspiration in the continental moisture source, and the interannual variability in RH in different regions. Nevertheless, considering gridded datasets at the global scale, we found that this good agreement is restricted only to the arid and semiarid regions. In humid regions, soil moisture is not constrained so land evapotranspiration variability is mostly driven by changes in the AED (Stephenson, 1990). This makes it difficult to unravel the possible direct contribution of land evapotranspiration to the variability in RH using statistical approaches and empirical information, particularly with the strong coupling among these variables. Land evapotranspiration is closely related to precipitation variability in arid and semiarid regions; increased land evapotranspiration tends to be caused primarily by increased precipitation, which is accompanied by corresponding RH anomalies. Also, RH may affect land evapotranspiration, both in arid and humid regions, given its important contribution to the aerodynamic component of the AED (Wang et al., 2012; Vicente-Serrano et al., 2014a).
Nevertheless, although the interannual variability in these three variables is coupled in some regions, its long-term trends may strongly differ as a consequence of changes in precipitation, increasing influence of the AED, and also changes in land and atmospheric contribution to RH and precipitation. The 14 analyzed regions, in which FLEXPART was applied, show a relevant continental contribution (E–P) to precipitation The average contribution is generally below 40 % of the total precipitation in some regions (e.g., western Europe, Scandinavia, or western North America), but exceeds 50 % in specific regions (e.g., Sahel and eastern China).
Therefore, it is reasonable to consider that changes in the contribution of continental areas to precipitation may affect land evapotranspiration processes and ultimately affect RH variability. Thus, our results suggest an influence of land–atmosphere water feedbacks and recycling processes on RH trends. This is simply because more available soil humidity under favorable atmospheric and land conditions would result in more evapotranspiration and accordingly higher air moisture (Eltahir and Bras, 1996; Dominguez et al., 2006; Kunstmann and Jung, 2007). Recalling that the ocean surface contributes about 84 % of the water evaporated over the Earth (Oki, 2005), oceanic evaporation is highly important for continental precipitation (Gimeno et al., 2010). However, the continental humidity sources can be more important than oceanic sources in some regions (e.g., the Sahel) (Wei et al., 2016a). In this context, our results concur with previous works. For example, numerous model-based studies have supported an influence of land evaporation processes on air humidity, and precipitation over land surface (e.g., Bosilovich and Chern, 2006; Dirmeyer et al., 2009; Goessling and Reick, 2011) recycling is strongly important in some regions of the world, such as China and central Asia, the western part of Africa, and central South America (Pfahl et al., 2014; van der Ent et al., 2010, and in general in semiarid and desert areas worldwide (Miralles et al., 2016). All these studies assessed the role of continental evapotranspiration on average precipitation conditions, with few studies focusing on the possible impacts of changes in soil moisture and evapotranspiration on RH. In Europe, Rowell and Jones (2006) concluded for future climate scenarios that reduced evaporation in summer will drop RH and hence continental rainfall.
Although our study was limited to specific regions across the world, results indicate that humidity in the analyzed regions substantially originates over continents. This finding concurs with some regional studies that defined sources of moisture (e.g., Nieto et al., 2014; Gimeno et al., 2010; Drumond et al., 2014; Ciric et al., 2016). Overall, the spatial differences in the possible attribution of the observed changes in RH to changes in land evapotranspiration are important. Nevertheless, in some regions our results suggest a robust contribution of land processes to the interannual variability in RH. A representative example is La Plata, where a strong decrease (−6.6 % from 1979 to 2014) in RH is suggested by both observations and ERA-Interim. This region did not exhibit a significant trend in precipitation, but conversely there is a significant decrease in absolute humidity and land evapotranspiration. In the La Plata region, the oceanic evaporation in the source region has shown a significant increase (6.33 %) since 1979. However, this increase seems to be insufficient to favor an increase in RH values. Herein, although the average oceanic contribution (E–P) to precipitation is slightly higher (54 %), compared to the continental contribution (46 %), the interannual variability in RH is positively correlated with the interannual variability in land E–P rather than oceanic E–P. Moreover, this region exhibited a significant decrease in land contribution to precipitation between 1979 and 2014.
In the western US, the large decrease in RH (−6.2 %) corresponded to a large decrease in the absolute humidity (−0.58 g kg−1). However, it is difficult to attribute this pattern to changes in land evapotranspiration, given the low (37 %) continental contribution to precipitation. Wei et al. (2016b) showed that the transport of atmospheric moisture from the Pacific is the main contributor to the interannual variability in precipitation in the region. In this sense, we found a strong relationship between the interannual variability in RH and the oceanic E–P, albeit with insignificant trends in the oceanic and continental contribution (E–P) to precipitation in the region. Here, in the absence of significant changes in oceanic evaporation and contribution to precipitation, it is reasonable to consider that the decrease in absolute humidity is linked to the atmospheric circulation that controls moisture transport in the region (Wei et al., 2016b), but the decrease in RH could also be favored by the trend toward higher differences between air temperature in the land target region and the SST in the source region.
Therefore, the relationships among RH, land evapotranspiration variability, and changes in the contribution of continental areas can be extremely complex. Similarly, the relationships between RH and land evapotranspiration are rather complex and cannot be easily interpreted.
Nonetheless, albeit with the strong uncertainty existing at the global scale, it is reasonable to consider that changes in soil moisture budget, combined with land evapotranspiration, could somehow impact the observed RH trends. In the same context, there is strong evidence that low levels of soil moisture and land evapotranspiration are usually accompanied by a reinforcement of low RH, particularly during drought episodes. Under these circumstances, the suppression of the latent heat flows from the soil to the atmosphere would enhance soil and vegetation warming and sensible heat, inducing air temperature rise and the reinforcement of heat waves (Hirschi et al., 2011). Seneviratne et al. (2002) showed that vegetation control on transpiration might contribute significantly to enhancement of summer drying, particularly when soil water is limited. Other studies confirmed this finding, employing both observational data (e.g., Hirschi et al., 2011) and model outputs (e.g., Seneviratne et al., 2006; Fischer et al., 2007).
4.3 Contribution of oceans to changes in RH
We indicated strong differences among the 14 analyzed regions in terms of the contribution of Oceanic water bodies to RH variability. In some regions (e.g., western North America, India, Scandinavia, and Amazonia), the interannual variability in RH is closely related to oceanic E–P, indicating that changes in oceanic evaporation, combined with the processes of atmospheric moisture transport to target regions, play a main role in explaining changes in RH. Moisture advection is the main driver of precipitation variability (Trenberth, 1999; Wei et al., 2016a). Nevertheless, there is some uncertainty in recent trends in moisture advections from oceanic areas (Zahn and Allan, 2013). As such, it is difficult to determine – in general terms – whether the strong complexity of RH changes identified at the global scale is driven by changes in moisture advections from oceanic areas, given that – in the context of changing climate – SST, oceanic evaporation, and oceanic contribution to precipitation in the target regions can jointly account for the possible influence of oceans on RH variability in some regions.
Different modeled climate studies suggested strong differences between land and ocean RH trends, as a consequence of the different warming rates between oceanic and continental areas (e.g., Joshi et al., 2008; Dessler and Sherwood, 2009; O'Gorman and Muller, 2010). As the warming rates are generally slower over oceans, the specific humidity of air advected from oceans to continents would increase more slowly than the saturation-specific humidity over land, causing a reduction in RH (Rowell and Jones, 2006). Due to this effect, RH will not remain constant in areas located very far from humidity sources, as warmer air temperatures under limited moisture humidity would reduce RH (Pierce et al., 2013). This physical process could explain observed RH trends in some regions (e.g., Amazonia, where around 68 % of the average atmospheric moisture originates over oceanic sources). In this region RH is correlated with the oceanic E–P, although there is no change in the oceanic contribution to precipitation from 1979 to 2014. Moreover, RH strongly decreased at the annual scale (−7.7 %), as a consequence of a decrease in the absolute humidity (−0.56 g kg−1), accompanied by an increase in air temperature (1.09 ∘C). While SST in the oceanic source region slightly increased by 0.33 ∘C, other variables (i.e., oceanic evaporation, precipitation, and land evapotranspiration) did not exhibit significant changes. Herein, we believe that the mechanisms proposed by Sherwood and Fu (2014) to explain decreased RH are applicable to our study. They attributed RH decrease to subsaturated oceanic moisture supply, which compensates for air temperature increase. In this study, this mechanism is also capable of explaining RH variability, given that the difference in warming rates between SST in the oceanic moisture source region and air temperature of Amazonia is increasing. This feature is also supported by the significant correlation found between the interannual variability in RH and the ratio between air temperature over land and SST. A similar pattern is found for the eastern Sahel, a region in which continental recycling is particularly important (Wei et al., 2016a). This region witnessed a strong decrease in RH, but it was not compensated for by increased precipitation. Although there is no significant correlation between RH and the ratio between air temperature and SST, the latter variable shows a significant increase. This could reinforce the drying effect of the suggested trend toward a lower moisture supply from the oceanic source, especially with the significant negative trend in oceanic contribution to precipitation in this region.
In other regions, there are no empirical relationships that confirm the impact of oceanic moisture supply processes on RH changes. A possible explanation of these contrasting findings could be related to the low differences in the warming rates between the oceanic sources and the majority of the continental target areas. We found that – in most cases – these differences were not strong enough to generate a clear effect at the global scale, particularly with the available number of observations.
Although oceanic evaporation is decisive on moisture supply to continental regions (Gimeno et al., 2010), several processes, which are not considered in this study, may strongly affect RH and precipitation in continental areas. A global warming signal does not necessarily imply above-normal oceanic evaporation. Here, we indicated that oceanic evaporation trends for 1979–2014 showed strong spatial variability, with dominant positive trends. Nevertheless, large areas also exhibited insignificant trends and even negative evaporation trends. While SST increase is mainly associated with radiative processes, evaporation processes are mainly controlled by a wide range of meteorological variables that impact the aerodynamic and radiative components of the AED rather than SST alone (McVicar et al., 2012b). Thus, changes in solar radiation and wind speed can also influence the evaporation evolution (Yu, 2007; Kanemaru and Masunaga, 2013).
Due to the unlimited water availability over oceans, air vapor pressure deficit would be expected to be driven by the Clausius–Clapeyron relation. Nevertheless, the observed evolution indicates that the global mean precipitation and evaporation is not scaled by the Clausius–Clapeyron relation (Held and Soden, 2006). As such, given the slow oceanic evaporation trends in large regions of the world, RH trends in some of the analyzed regions could be seen in the context of a lower water supply to maintain constant RH, particularly with air temperature rise.
Herein, we have not considered possible changes in other variables that could explain the weak relationship among RH, oceanic evaporation, and oceanic moisture contribution, for example, the transport mechanisms between the source and target regions, which are key variables in some regions like the western North America (Wei et al., 2016b). Moreover, moisture source regions are not stationary, as the intensity of humidity can vary greatly from one year to another (Gimeno et al., 2013). This aspect could be another source of uncertainty in the explanatory factors of current RH trends. Furthermore, other different factors that control atmospheric humidity and RH have not been addressed in this study. Sherwood (1996) indicated that RH distributions are strongly controlled by dynamical fields rather than local air temperatures. This suggests that atmospheric circulation processes could largely affect the temporal variability and trends in RH. A range of studies indicate noticeable RH changes in response to low-frequency atmospheric oscillations, such as the Atlantic Multidecadal Oscillation (AMO) and El Niño–Southern Oscillation (e.g., McCarthy and Toumi, 2004; Zhang et al., 2013), regional circulation (Wei et al., 2016a, b), and changes in the Hadley cell (HC) (Hu and Fu, 2007). Wright et al. (2010) employed a global climate model under double CO2 concentrations to show that tropical and subtropical RH is largely dependent on a poleward expansion of the Hadley cell: a deepening of the height of convective detrainment, a poleward shift of the extratropical jets, and an increase in the height of the tropopause. Also, Laua and Kim (2015) assessed changes in the HC under CO2 warming from the Coupled Model Intercomparison Project Phase 5 (CMIP5) model projections. They suggest that strengthening of the HC induces atmospheric moisture divergence and reduces tropospheric RH in the tropics and subtropics; this spatial pattern resembles those areas with negative RH trends in the Northern Hemisphere as well as the Southern Hemisphere, as described in this study.
This study analyzed relative humidity (RH) trends at the global scale using observations and ERA-40 data. It extended further to link RH trends with a range of variables, which can give indications on the possible oceanic and continental contribution to RH trends. Our results suggest significant RH trends over many regions worldwide and a generally dominant negative trend at the global scale.
The strong diversity in the observed RH trends highlights the complex and divergent role of different physical processes, including both dynamic and thermodynamic components. In general the supply of specific humidity is a main source of the observed RH trends since there is a high agreement between RH and specific humidity trends. This finding suggests that the evolution of specific humidity in vast areas of the world has not provided the necessary humidity to maintain constant RH according to the observed warming trends.
This study also analyzed the possible contribution of continental and oceanic moisture supply to explaining the magnitude and spatial patterns of RH trends. For this purpose, 14 regions were defined and the contribution of continental and oceanic sources to RH was assessed using a Lagrangian scheme. Results indicate that no single physical mechanism can be responsible for the observed trends in RH at the global scale. Our findings stress two hypotheses, (i) land water supply and (ii) insufficient oceanic moisture supply to maintain constant continental RH, could act together to explain recent RH trends. However, although it is quite difficult to establish a direct causality between RH and different underlying processes using different empirical sources, the observed decrease in RH in some regions (e.g., La Plata) can be linked to the lower water supply from land evapotranspiration. In other regions, the empirical relationships suggest dynamic and thermodynamic mechanisms related to moisture supply from oceanic source regions (e.g., Amazonia and western North America). Taken together, these physical mechanisms could coexist in some regions given the strong relationship found among precipitation, RH, and land evapotranspiration.
Overall, this study confirms the strong complexity of determining a general physical process that may explain the complex spatial patterns of RH trends, particularly at the global scale. As such, further research is still needed to unravel the complex physical factors driving the dominant RH negative trends over large continental regions. The availability of long-term historical and reanalyses data and the advancement of modeling approaches are potential assets in any future research to explore whether the land and oceanic processes drive the observed RH trends. This is important, given that understanding current RH is relevant in hydroclimatic research due to its impacts on atmospheric evaporative demand, crop development and yield, forest fire risk, and bioclimatic comfort in addition to other hydrological processes.
The monthly RH HadISDH dataset is publicly available and can be download from http://www.metoffice.gov.uk/hadobs/hadisdh (last access: 27 June 2018). The reanalysis RH dataset compounded by daily dew point data, air temperature, and surface pressure is available here http://www.ecmwf.int/en/research/climate-reanalysis/era-interim (last access: 27 June 2018). Gridded land precipitation and surface air temperature data are provided by the Climate Research Unit (CRU, UK); this information is available at http://www.cru.uea.ac.uk/data (last access: 27 June 2018). Monthly sea surface temperature (HadSST3) is available at the Hadley Center website (http://www.metoffice.gov.uk/hadobs/hadsst3/, last access: 27 June 2018). The ocean evaporation dataset is available through the OAFlux product (Yu et al., 2008). Land evapotranspiration data were obtained from Global Land Evaporation Amsterdam Model (GLEAM) (version 3.0a) (http://www.gleam.eu/, last access: 27 June 2018).
The supplement related to this article is available online at: https://doi.org/10.5194/esd-9-915-2018-supplement.
SMVS, RN, and LG designed the research. SMVS and RN performed research. SMVS drafted the paper. CAM, AD, AEK, FDC, MTB, and MPG analyzed data, and all authors contributed to writing the paper.
The authors declare that they have no conflict of interest.
This article is part of the special issue “The 8th EGU Leonardo Conference: From evaporation to precipitation: the atmospheric moisture transport”. It is a result of the 8th EGU Leonardo Conference, Ourense, Spain, 25–27 October 2016.
We thank Helge F. Goessling and the two anonymous reviewers for their
insightful and constructive comments, which significantly improved the
quality of the paper. This work was supported by the EPhysLab (UVIGO-CSIC
Associated Unit), PCIN-2015-220, CGL2014-52135-C03-01, and CGL2014-60849-JIN
financed by the Spanish Commission of Science and Technology, and FEDER,
IMDROFLOOD financed by the Water Works 2014 co-funded call of the European
Commission and INDECIS, which is part of ERA4CS, an ERA-NET initiated by JPI
Climate. This study was also funded by FORMAS (SE), DLR (DE), BMWFW (AT), IFD
(DK), MINECO (ES), and ANR (FR) with co-funding from the European Union
(grant 690462).
Edited by: Axel
Kleidon
Reviewed by: Helge Goessling and two anonymous
referees
Berg, A., Findell, K., Lintner, B., Giannini, A., Seneviratne, S. I., van den Hurk, B., Lorenz, R., Pitman, A., Hagemann, S., Meier, A., Cheruy, F., Ducharne, A., Malyshev, S., and Milly P. C. D.: Land-atmosphere feedbacks amplify aridity increase over land under global warming, Nat. Clim. Change, 6, 869–874, 2016.
Bosilovich, M. G. and Chern, J.-D.: Simulation of water sources and precipitation recycling for the MacKenzie, Mississippi, and Amazon River basins, J. Hydrometeorol., 7, 312–329, 2006.
Buck, A. L.: New equations for computing vapor pressure and enhancement factor, J. Appl. Meteorol., 20, 1527–1532, 1981.
Byrne, M. P. and O'Gorman, P. A.: Link between land-ocean warming contrasts and surface relative humidities in simulations with coupled climate models, Geophys. Res. Lett., 40, 5223–5227, 2013.
Ciric, D., Stojanovic, M., Drumond, A., Nieto, R., and Gimeno, L.: Tracking the origin of moisture over the Danube river basin using a Lagrangian approach, Atmosphere, 7, 162, https://doi.org/10.3390/atmos7120162, 2016.
Dai, A.: Recent climatology, variability, and trends in global surface humidity, J. Climate, 19, 3589–3606, 2006.
Dee, D. P., Uppala, S. M., Simmons, A. J., Berrisford, P., Poli, P., Kobayashi, S., Andrae, U., Balmaseda, M. A., Balsamo, G., Bauer, P., Bechtold, P., Beljaars, A. C., van de Berg, L., Bidlot, J., Bormann, N., Delsol, C., Dragani, R., Fuentes, M., Geer, A. J., Haimberger, L., Healy, S. B., Hersbach, H., Hólm, E. V., Isaksen, L., Kållberg, P., Köhler, M., Matricardi, M., McNally, A. P., Monge-Sanz, B. M., Morcrette, J., Park, B., Peubey, C., de Rosnay, P., Tavolato, C., Thépaut, J., and Vitart, F.: The ERA-Interim reanalysis: configuration and performance of the data assimilation system, Q. J. Roy. Meteor. Soc., 137, 553–597, 2011.
Dessler, A. E. and Sherwood, S. C.: Atmospheric Science: A Matter of Humidity, Science, 323, 1020–1021, 2009.
Dirmeyer, P. A., Schlosser, C. A., and Brubaker, K. L.: Precipitation, recycling, and land memory: An integrated analysis, J. Hydrometeorol., 10, 278–288, 2009.
Dominguez, F., Kumar, P., Liang, X., and Ting, M.: Impact of atmospheric moisture storage on precipitation recycling, J. Climate, 19, 1513–1530, 2006.
Drumond, A., Marengo, J., Ambrizzi, T., Nieto, R., Moreira, L., and Gimeno, L.: The role of the Amazon Basin moisture in the atmospheric branch of the hydrological cycle: a Lagrangian analysis, Hydrol. Earth Syst. Sci., 18, 2577–2598, https://doi.org/10.5194/hess-18-2577-2014, 2014.
Eltahir, E. A. B. and Bras, R. L.: Precipitation recycling, Rev. Geophys., 34, 367–378, 1996.
Fan, Z.-X. and Thomas, A.: Spatiotemporal variability of reference evapotranspiration and its contributing climatic factors in Yunnan Province, SW China, 1961–2004, Climatic Change, 116, 309–325, 2013.
Fasullo, J. T.: Robust land-ocean contrast in energy and water cycle feedbacks, J. Climate, 23, 4677–4693, 2010.
Ferraro, A. J., Lambert, F. H., Collins, M., and Miles, G. M.: Physical mechanisms of tropical climate feedbacks investigated using temperature and moisture trends, J. Climate, 28, 8968–8987, 2015.
Fischer, E. M., Seneviratne, S. I., Vidale, P. L., Lüthi, D., and Schär, C.: Soil moisture-atmosphere interactions during the 2003 European summer heat wave, J. Climate, 20, 5081–5099, 2007.
Gimeno, L., Nieto, R., Trigo, R. M., Vicente-Serrano, S. M., and López-Moreno, J. I.: Where does the Iberian Peninsula moisture come from? An answer based on a Lagrangian approach, J. Hydrometeorol., 11, 421–436, 2010.
Gimeno, L., Nieto, R., Drumond, A., Castillo, R., and Trigo, R.: Influence of the intensification of the major oceanic moisture sources on continental precipitation, Geophys. Res. Lett., 40, 1443–1450, 2013.
Goessling, H. F. and Reick, C. H.: What do moisture recycling estimates tell us? Exploring the extreme case of non-evaporating continents, Hydrol. Earth Syst. Sci., 15, 3217–3235, https://doi.org/10.5194/hess-15-3217-2011, 2011.
Hamed, K. H. and Rao, A. R.: A modified Mann Kendall trend test for autocorrelated data, J. Hydrol., 204, 182–196, 1998.
Harris, I., Jones, P. D., Osborn, T. J., and Lister, D. H.: Updated high-resolution grids of monthly climatic observations – the CRU TS3.10 Dataset, Int. J. Climatol., 34, 623–642, 2014.
Held, I. M. and Soden, B. J.: Robust responses of the hydrological cycle to global warming, J. Climate, 19, 5686–5699, 2006.
Hirschi, M., Seneviratne, S. I., Alexandrov, V., Boberg, F., Boroneant, C., Cristensen, O. B., Formayer, H., Orlowsky, B., and Stepanek, P.: Observational evidence for soil-moisture impact on hot extremes in southeastern Europe, Nat. Geosci., 4, 17–21, 2011.
Hosseinzadeh Talaee, P., Sabziparvar, A. A., and Tabari, H.: Observed changes in relative humidity and dew point temperature in coastal regions of Iran, Theor. Appl. Climatol., 110, 385–393, 2012.
Hu, Y. and Fu, Q.: Observed poleward expansion of the Hadley circulation since 1979, Atmos. Chem. Phys., 7, 5229–5236, https://doi.org/10.5194/acp-7-5229-2007, 2007.
IPCC: Climate Change 2013: The Physical Science Basis. Contribution of Working Group I to the Fifth Assessment Report of the Intergovernmental Panel on Climate Change, edited by: Stocker, T. F., Qin, D., Plattner, G.-K., Tignor, M., Allen, S. K., Boschung, J., Nauels, A., Xia, Y., Bex, V., and Midgley, P. M., Cambridge University Press, Cambridge, United Kingdom and New York, NY, USA, 1535 pp., 2013.
Jensen, M. E., Burman, R. D., and Allen, R. G. (Eds.): Evapotranspiration and Irrigation Water Requirements: ASCE Manuals and Reports on Engineering Practices No. 70, American Society of Civil Engineers, New York, 360 pp., 1990.
Jhajharia, D., Shrivastava, S. K., Sarkar, D., and Sarkar, S.: Temporal characteristics of pan evaporation trends under the humid conditions of northeast India, Agr. Forest Meteorol., 149, 763–770, 2009.
Joshi, M. M., Gregory, J. M., Webb, M. J., Sexton, D. M. H., and Johns, T. C.: Mechanisms for the land/sea warming contrast exhibited by simulations of climate change, Clim. Dynam., 30, 455–465, 2008.
Kanemaru, K. and Masunaga, H.: A satellite study of the relationship between sea surface temperature and column water vapor over tropical and subtropical oceans, J. Climate, 26, 4204–4218, 2013.
Kennedy, J. J., Rayner, N. A., Smith, R. O., Saunby, M., and Parker, D. E.: Reassessing biases and other uncertainties in sea-surface temperature observations since 1850 part 1: measurement and sampling errors, J. Geophys. Res., 116, D14103, https://doi.org/10.1029/2010JD015220, 2011a.
Kennedy, J. J., Rayner, N. A., Smith, R. O., Saunby, M., and Parker, D. E.: Reassessing biases and other uncertainties in sea-surface temperature observations since 1850 part 2: biases and homogenisation, J. Geophys. Res., 116, D14104, https://doi.org/10.1029/2010JD015218, 2011b.
Kunstmann, H. and Jung, G.: Influence of soil-moisture and land use change on precipitation in the Volta basin of West Africa, International Journal of River Basin Management, 5, 9–16, 2007.
Lambert, F. H. and Chiang, J. C. H.: Control of land-ocean temperature contrast by ocean heat uptake, Geophys. Res. Lett., 34, L13704, https://doi.org/10.1029/2007GL029755, 2007.
Laua, W. K. M. and Kim, K.-M.: Robust Hadley circulation changes and increasing global dryness due to CO2 warming from CMIP5 model projections, P. Natl. Acad. Sci. USA, 112, 3630–3635, 2015.
Lorenz, D. J. and DeWeaver, E. T.: The response of the extratropical hydrological cycle to global warming, J. Climate, 20, 3470–3484, 2007.
Marengo, J. A., Nobre, C. A., and Tomasella, J.: The drought of Amazonia in 2005, J. Climate, 21, 495–516, 2008.
Martens, B., Miralles, D. G., Lievens, H., van der Schalie, R., de Jeu, R. A. M., Fernández-Prieto, D., Beck, H. E., Dorigo, W. A., and Verhoest, N. E. C.: GLEAM v3: satellite-based land evaporation and root-zone soil moisture, Geosci. Model Dev., 10, 1903–1925, https://doi.org/10.5194/gmd-10-1903-2017, 2017.
McCarthy, M. P. and Toumi, R.: Observed interannual variability of tropical troposphere relative humidity, J. Climate, 17, 3181–3191, 2004.
McCarthy, M. P., Thorne, P. W., and Titchner, H. A.: An analysis of tropospheric humidity trends from radiosondes, J. Climate, 22, 5820–5838, 2009.
McVicar, T. R., Roderick, M. L., Donohue, R. J., and Van Niel, T. G.: Less bluster ahead? Ecohydrological implications of global trends of terrestrial near-surface wind speeds, Ecohydrology, 5, 381–388, 2012a.
McVicar, T. R., Roderick, M. L., Donohue, R. J., Tao Li, L., Van Niel, T. G., Thomas, A., Grieser, J., Jhajharia, D., Himri, Y., Mahowald, N. M., Mescherskaya, A. V., Kruger, A. C., Rehman, S., and Dinpashoh, Y.: Global review and synthesis of trends in observed terrestrial near-surface wind speeds: implications for evaporation, J. Hydrol., 416–417, 182–205, 2012b.
Miralles, D. G., Holmes, T. R. H., De Jeu, R. A. M., Gash, J. H., Meesters, A. G. C. A., and Dolman, A. J.: Global land-surface evaporation estimated from satellite-based observations, Hydrol. Earth Syst. Sci., 15, 453–469, https://doi.org/10.5194/hess-15-453-2011, 2011.
Miralles, D. G., Nieto, R., McDowell, N. G., Dorigo, W. A., Verhoest, N. E. C., Liu, Y. Y., Teuling, A. J., Dolman, A. J., Good, S. P., and Gimeno, L.: Contribution of water-limited ecoregions to their own supply of rainfall, Environ. Res. Lett., 11, 124007, https://doi.org/10.1088/1748-9326/11/12/124007, 2016.
Nieto, R., Castillo, R., Drumond, A., and Gimeno, L.: A catalog of moisture sources for continental climatic regions, Water Resour. Res., 50, 5322–5328, 2014.
O'Gorman, P. A. and Muller, C. J.: How closely do changes in surface and column water vapor follow Clausius-Clapeyron scaling in climate change simulations?, Environ. Res. Lett., 5, 025207, https://doi.org/10.1088/1748-9326/5/2/025207, 2010.
Oki, T.: The hydrologic cycles and global circulation, Encyclopedia of Hydrological Sciences, 13–22, 2005.
Pfahl, S., Madonna, E., Boettcher, M., Joos, H., and Wernli, H.: Warm conveyor belts in the ERA-Interim Dataset (1979–2010). Part II: Moisture origin and relevance for precipitation, J. Climate, 27, 27–40, 2014.
Pierce, D. W., Westerling, A. L., and Oyler, J.: Future humidity trends over the western United States in the CMIP5 global climate models and variable infiltration capacity hydrological modeling system, Hydrol. Earth Syst. Sci., 17, 1833–1850, https://doi.org/10.5194/hess-17-1833-2013, 2013.
Rebetez, M., Mayer, H., Dupont, O., Schindler, D., Gartner, K., Kropp, J. P., and Menzel, A.: Heat and drought 2003 in Europe: A climate synthesis, Ann. For. Sci., 63, 569–577, 2006.
Rodell, M., Beaudoing, H. K., L'Ecuyer, T. S., Olsona, W. S., Famigliettie, J. S., Houserf, P. R., Adlerb, R., Bosilovicha, M. G., Claysong, C. A., Chambersh, D., Clarki, E., Fetzere, E. J., Gaoj, X., Gua, G., Hilburnk, K., Huffmana, G. J., Lettenmaieri, D. P., Liue, W. T., Robertsonl, F. R., Schlosserj, C. A., Sheffieldm, J., and Woodm, E. F.: The observed state of the water cycle in the early twenty-first century, J. Climate, 28, 8289–8318, 2015.
Roderick, M. and Farquhar, G. D.: The cause of decreased pan evaporation over the past 50 years, Science, 15, 1410–1411, 2002.
Rowell, D. P. and Jones, R. G.: Causes and uncertainty of future summer drying over Europe, Clim. Dynam., 27, 281–299, 2006.
Seneviratne, S. I., Pal, J. S., Eltahir, E. A. B., and Schar, C.: Summer dryness in a warmer climate: A process study with a regional climate model, Clim. Dynam., 20, 69–85, 2002.
Seneviratne, S. I., Lüthi, D., Litschi, M., and Schär, C.: Land-atmosphere coupling and climate change in Europe, Nature, 443, 205–209, 2006.
Shenbin, C., Yunfeng, L., and Thomas, A.: Climatic change on the Tibetan Plateau: Potential evapotranspiration trends from 1961–2000, Climatic Change, 76, 291–319, 2006.
Sherwood, S. C.: Maintenance of the free-tropospheric tropical water vapor distribution. Part I: Clear regime budget, J. Climate, 9, 2903–2918, 1996.
Sherwood, S. C.: Direct versus indirect effects of tropospheric humidity changes on the hydrologic cycle, Environ. Res. Lett., 5, 025206, https://doi.org/10.1088/1748-9326/5/2/025206, 2010.
Sherwood, S. and Fu, Q.: A drier future?, Science, 343, 737–739, 2014.
Simmons, A. J., Willett, K. M., Jones, P. D., Thorne, P. W., and Dee, D. P.: Low-frequency variations in surface atmospheric humidity, temperature, and precipitation: inferences from reanalyses and monthly gridded observational data sets, J. Geophys. Res.-Atmos., 115, D01110, https://doi.org/10.1029/2009JD012442, 2010.
Stephenson, N. L.: Climatic control of vegetation distribution: the role of the water balance, Am. Nat., 135, 649–670, 1990.
Stohl, A. and James, P.: A Lagrangian Analysis of the Atmospheric Branch of the GlobalWaterWater Cycle. Part I: Method Description, Validation and Demonstration for the August 2002 Flooding in Central Europe, J. Hydrometeorol., 5, 656–678, 2004.
Stohl, A. and James, P.: A Lagrangian analysis of the atmospheric branch of the global water cycle. II. Moisture transports between Earth's ocean basins and river catchments, J. Hydrometeorol., 6, 961–984, 2005.
Trenberth, K. E.: Atmospheric moisture recycling: Role of advection and local evaporation, J. Climate, 12, 1368–1381, 1999.
Trenberth, K. E., Fasullo, J., and Smith, L.: Trends and variability in column-integrated atmospheric water vapor, Clim. Dynam., 24, 741–758, 2005.
Trenberth, K. E., Smith, L., Qian, T., Dai, A., and Fasullo, J.: Estimates of the global water budget and its annual cycle using observational and model data, J. Hydrometeorol., 8, 758–769, 2007.
van der Ent, R. J., Savenije, H. H. G., Schaefli, B., and Steele-Dunne, S. C.: Origin and fate of atmospheric moisture over continents, Water Resour. Res., 46, W09525, https://doi.org/10.1029/2010WR009127, 2010.
Van Wijngaarden, W. A. and Vincent, L. A.: Trends in relative humidity in Canada from 1953–2003, B. Am. Meteorol. Soc., 4633–4636, 2004.
Vázquez, M., Nieto, R., Drumond, A., and Gimeno, L.: Moisture transport into the Arctic: Source-receptor relationships and the roles of atmospheric circulation and evaporation, J. Geophys. Res.-Atmos., 121, 493–509, 2016.
Vicente-Serrano, S. M., Azorin-Molina, C., Sanchez-Lorenzo, A., Revuelto, J., Morán-Tejeda, E., López-Moreno, J. I., and Espejo, F.: Sensitivity of reference evapotranspiration to changes in meteorological parameters in Spain (1961–2011), Water Resour. Res., 50, 8458–8480, 2014a.
Vicente-Serrano, S. M., Azorin-Molina, C., Sanchez-Lorenzo, A., Morán-Tejeda, E., Lorenzo-Lacruz, J., Revuelto, J., López-Moreno, J. I., and Espejo, F.: Temporal evolution of surface humidity in Spain: recent trends and possible physical mechanisms, Clim. Dynam., 42, 2655–2674, 2014b.
Vicente-Serrano, S. M., Azorin-Molina, C., Sanchez-Lorenzo, A., El Kenawy, A., Martín-Hernández, N., Peña-Gallardo, M., Beguería, S., and Tomas-Burguera, M.: Recent changes and drivers of the atmospheric evaporative demand in the Canary Islands, Hydrol. Earth Syst. Sci., 20, 3393–3410, https://doi.org/10.5194/hess-20-3393-2016, 2016.
Vincent, L. A., van Wijngaarden, W. A., and Hopkinson, R.: Surface temperature and humidity trends in Canada for 1953–2005, J. Climate, 20, 5100–5113, 2007.
Wang, K. and Dickinson, R. E.: A review of global terrestrial evapotranspiration: observation, modeling, climatology, and climatic variability, Rev. Geophys., 50, RG2005, https://doi.org/10.1029/2011RG000373, 2012.
Wang, K., Dickinson, R. E., and Liang, S.: Global atmospheric evaporative demand over land from 1973 to 2008, J. Climate, 25, 8353–8361, 2012.
Wei, J., Hua, S., and Zong-Liang, Y.: Impact of moisture flux convergence and soil moisture on precipitation: a case study for the southern United States with implications for the globe, Clim. Dynam., 46, 467–481, 2016a.
Wei, J., Jin, Q., Yang, Z.-L., and Dirmeyer, P. A.: Role of ocean evaporation in California droughts and floods, Geophys. Res. Lett., 43, 6554–6562, https://doi.org/10.1002/2016GL069386, 2016b.
Willett, K. M., Jones, P. D., Gillett, N. P., and Thorne, P. W.: Recent changes in surface humidity: Development of the HadCRUH dataset, J. Climate, 21, 5364–5383, 2008.
Willett, K. M., Dunn, R. J. H., Thorne, P. W., Bell, S., de Podesta, M., Parker, D. E., Jones, P. D., and Williams Jr., C. N.: HadISDH land surface multi-variable humidity and temperature record for climate monitoring, Clim. Past, 10, 1983–2006, https://doi.org/10.5194/cp-10-1983-2014, 2014.
Wright, J. S., Sobel, A., and Galewsky, J.: Diagnosis of relative humidity changes in a warmer climate, J. Climate, 23, 4556–4569, 2010.
Yu, L.: Global variations in oceanic evaporation (1958–2005): The role of the changing wind speed, J. Climate, 20, 5376–5390, 2007.
Yu, L., Jin, X., and Weller, R. A.: Multidecade Global Flux Datasets from the Objectively Analyzed Air-sea Fluxes (OAFlux) Project: Latent and sensible heat fluxes, ocean evaporation, and related surface meteorological variables, Woods Hole Oceanographic Institution, OAFlux Project Technical Report, OA-2008-01, Woods Hole, Massachusetts, 64 pp., 2008.
Yue, S. and Wang, C.: The Mann-Kendall Test Modified by Effective Sample Size to Detect Trend in Serially Correlated Hydrological Series, Water Resour. Manag., 18, 201–218, 2004.
Zahn, M. and Allan, R. P.: Quantifying present and projected future atmospheric moisture transports onto land, Water Resour. Res., 49, 7266–7277, https://doi.org/10.1002/2012WR013209, 2013.
Zhang, L., Wu, L., and Gan, B.: Modes and mechanisms of global water vapor variability over the twentieth century, J. Climate, 26, 5578–5593, 2013.
Zhang, X., Harvey, K. D., Hogg, W. D., and Yuzyk, T. R.: Trends in Canadian streamflow, Water Resour. Res., 37, 987–998, 2001.
Zongxing, L., Qi, F., Wei, L., Tingting, W., Yan, G., Yamin, W., Aifang, C., Jianguo, L., and Li, L.: Spatial and temporal trend of potential evapotranspiration and related driving forces in Southwestern China, during 1961–2009, Quatern. Int., 336, 127–144, 2014.