the Creative Commons Attribution 4.0 License.
the Creative Commons Attribution 4.0 License.
 | 08 Jun 2018
Tagging moisture sources with Lagrangian and inertial tracers: application to intense atmospheric river events
Vicente Pérez-Muñuzuri
Jorge Eiras-Barca
Daniel Garaboa-Paz
Two Lagrangian tracer tools are evaluated for studies on atmospheric moisture sources and pathways. In these methods, a moisture volume is assigned to each particle, which is then advected by the wind flow. Usual Lagrangian methods consider this volume to remain constant and the particle to follow flow path lines exactly. In a different approach, the initial moisture volume can be considered to depend on time as it is advected by the flow due to thermodynamic processes. In this case, the tracer volume drag must be taken into account. Equations have been implemented and moisture convection was taken into account for both Lagrangian and inertial models. We apply these methods to evaluate the intense atmospheric rivers that devastated (i) the Pacific Northwest region of the US and (ii) the western Iberian Peninsula with flooding rains and intense winds in early November 2006 and 20 May 1994, respectively. We note that the usual Lagrangian method underestimates moisture availability in the continent, while active tracers achieve more realistic results.
- Article
(6739 KB) -
Supplement
(379 KB) - BibTeX
- EndNote


Extreme precipitation and flooding in many areas of the world, particularly on the US and European west coasts, are often related to the presence of atmospheric rivers (ARs) (Dettinger et al., 2011; Eiras-Barca et al., 2016; Lavers and Villarini, 2013; Ralph and Dettinger, 2011; Waliser and Guan, 2017). ARs are narrow and elongated filamentous structures that seemingly transport moisture from the tropics into midlatitudes over a period of a few days and usually form in association with baroclinic systems (Eiras-Barca et al., 2018). AR conditions occur in the warm sector of extratropical cyclones and are characterized by large water vapor contents and transport at low levels (Ralph et al., 2004). For some AR events, a filamentous pattern develops and persists long enough to be considered a Lagrangian coherent structure (Garaboa-Paz et al., 2015, 2017). ARs have been shown to play a key role in extratropical tropospheric dynamics (Gimeno et al., 2016; Newell et al., 1992; Zhu and Newell, 1998). The advection and convergence of moisture along ARs is a key process for Earth's sensible and latent heat redistribution and has a strong impact on the midlatitude water cycle by increasing tropospheric water vapor mixing (Zhu and Newell, 1998).
Among the transport mechanisms linked to ARs, tropical moisture exports (TMEs) have been shown to be the principal precursor of the most extreme events, carrying massive amounts of moisture from the tropics to midlatitudes (Eiras-Barca et al., 2017; Ramos et al., 2016). However, some authors have pointed to local midlatitude moisture as an important source of water vapor in AR events (Dettinger et al., 2015). Some of them even identified the convergence mechanism as the principal source in AR events (Bao et al., 2006; Cordeira et al., 2011; Dacre et al., 2015), evidencing the lack of agreement in this matter, which is still under discussion.
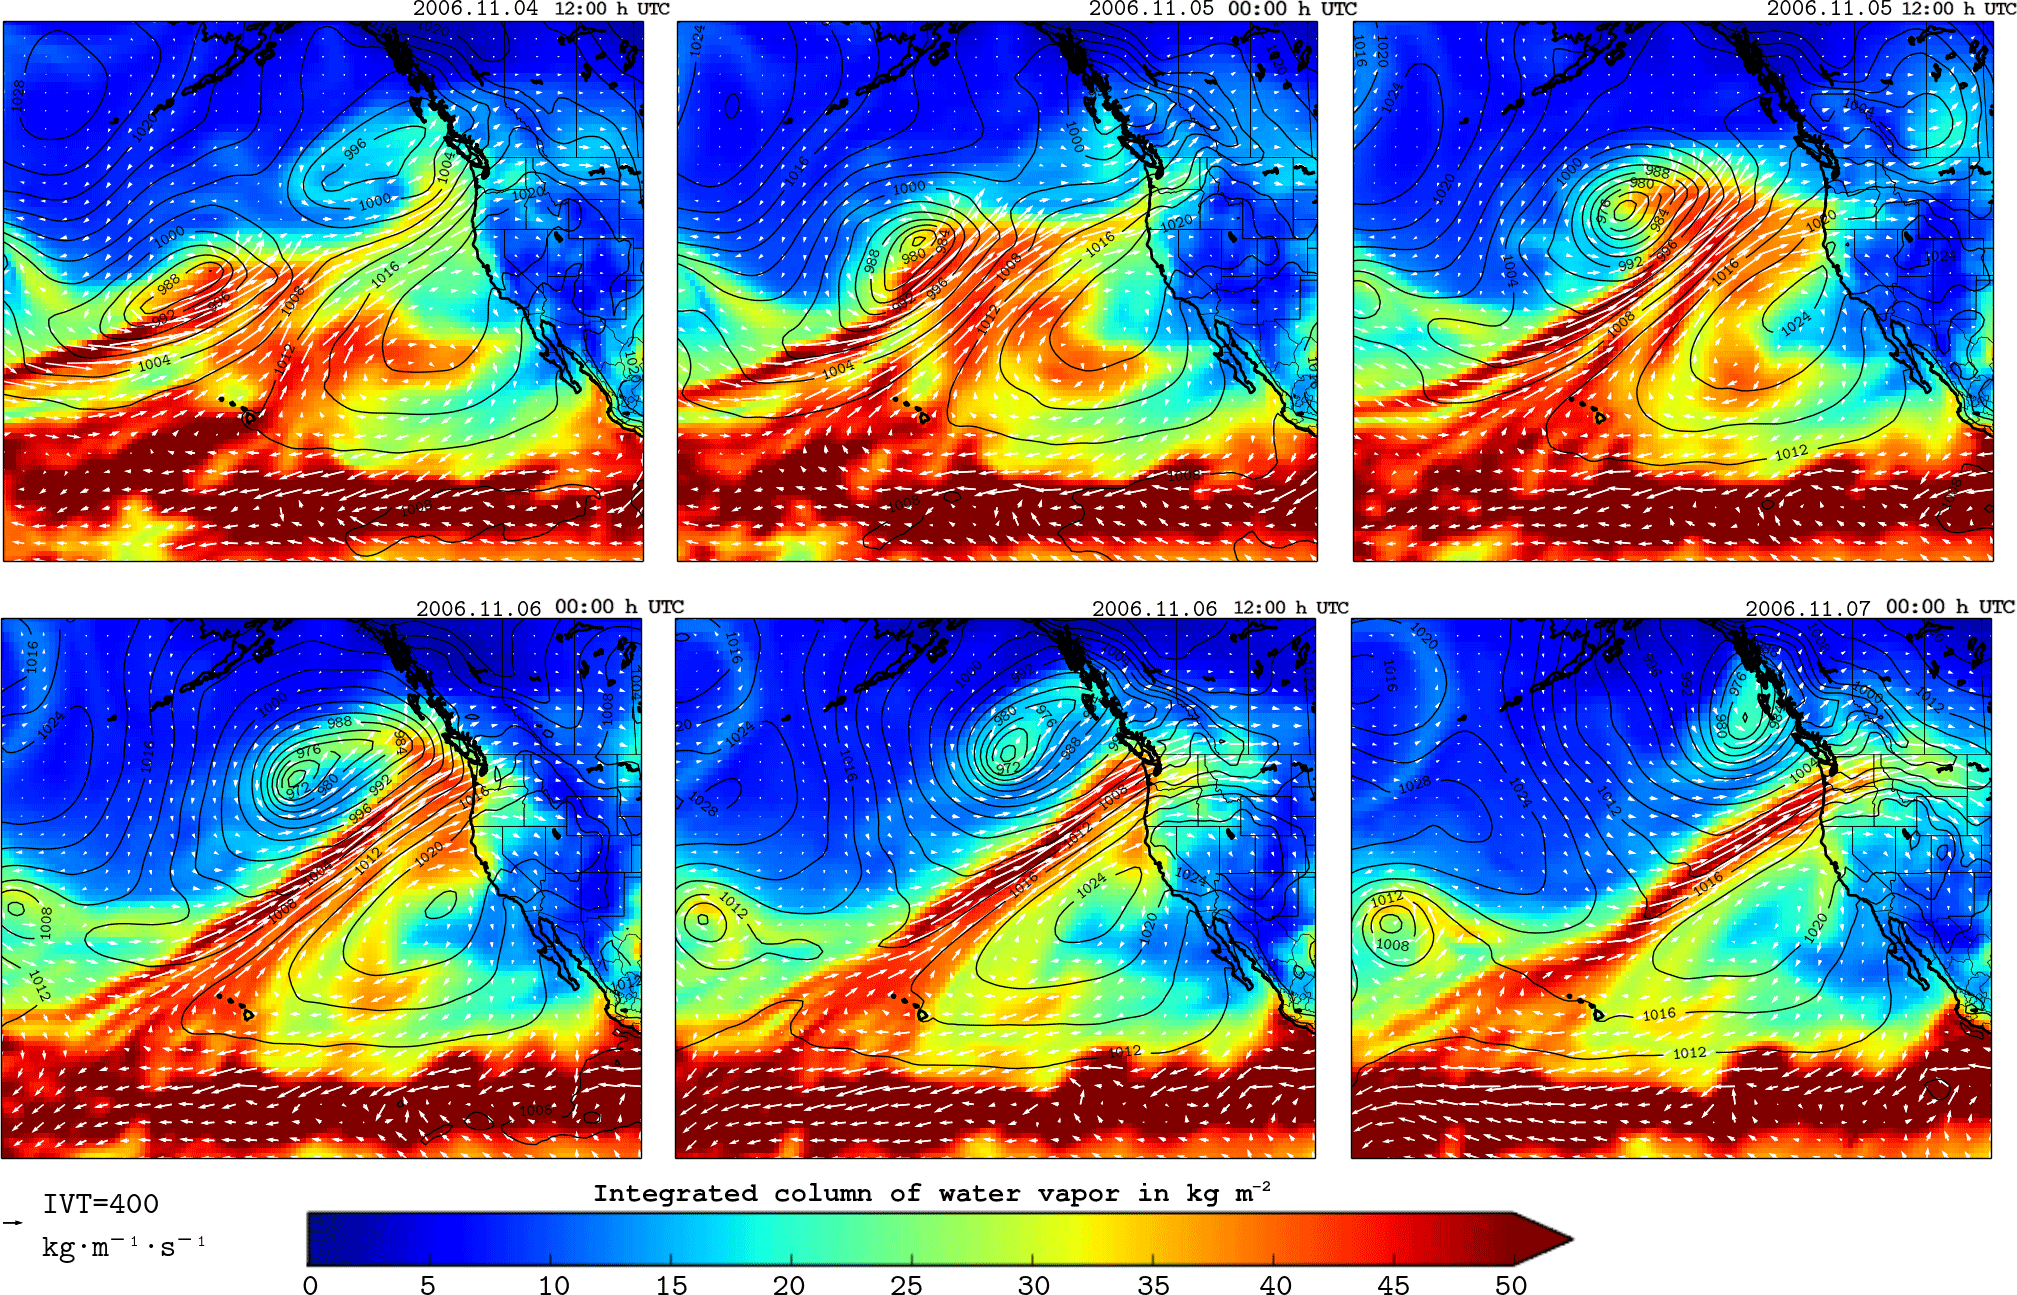
Figure 1Composite analysis of vertically integrated horizontal water vapor transport (IVT; kg m−1 s−1) and the integrated column of water vapor (IWV; kg m−2) derived from the ERA-Interim daily reanalysis dataset for 4–7 November 2006.
The present study examines two well-observed extreme precipitation events to better understand the role of the landfalling ARs that devastated portions of the US Pacific Northwest and the western Iberian Peninsula coasts with torrential rains and severe flooding on 6–7 November 2006 (Fig. S1 in the Supplement) (Neiman et al., 2008) and 20 May 1994 (Fig. S2) (Lavers and Villarini, 2013), respectively. Composite analysis of vertically integrated water vapor transport (IVT) and the integrated column of water vapor (IWV; Figs. 1 and 2) provides a depiction of the landfalling AR during its most destructive phase. Both figures show a narrow plume extending northeastward from the tropical moisture reservoir to the Pacific Northwest of the US and the western Iberian Peninsula and strongly suggest the direct incorporation of tropical moisture into the AR. For the 2006 event in the Pacific basin, the high amounts of moisture transported by the AR can be partially explained by the tropical origin of the cyclone, which in conjunction with an anticyclone located to the southeast increases the poleward and eastward flux of moisture along its track to midlatitudes. For the 1994 event in the Atlantic basin, the transport of moisture is enhanced by the combined action of a cyclone located northwest of the head of the AR and an anticyclone located southeastward of the AR. Landfalling AR events were observed to occur on 6 November 2006 and 20 May 1994, respectively, and led to important precipitation amounts (Fig. 3) on the northwestern coast of North America and the Iberian Peninsula.
Figures S1 and S2 show the precipitation rate throughout the cyclone's life for the events over the Pacific and Atlantic, respectively. In both cases the bulk of precipitation is located ahead of the AR, in the warm sector, close to the center of the cyclone. Figures S3 and S4 (500 hPa geopotential height for the Pacific and the Atlantic events) show that both systems were strongly linked to upper levels throughout the incursion of a low-pressure trough, which enhanced the vertical motions in the system.
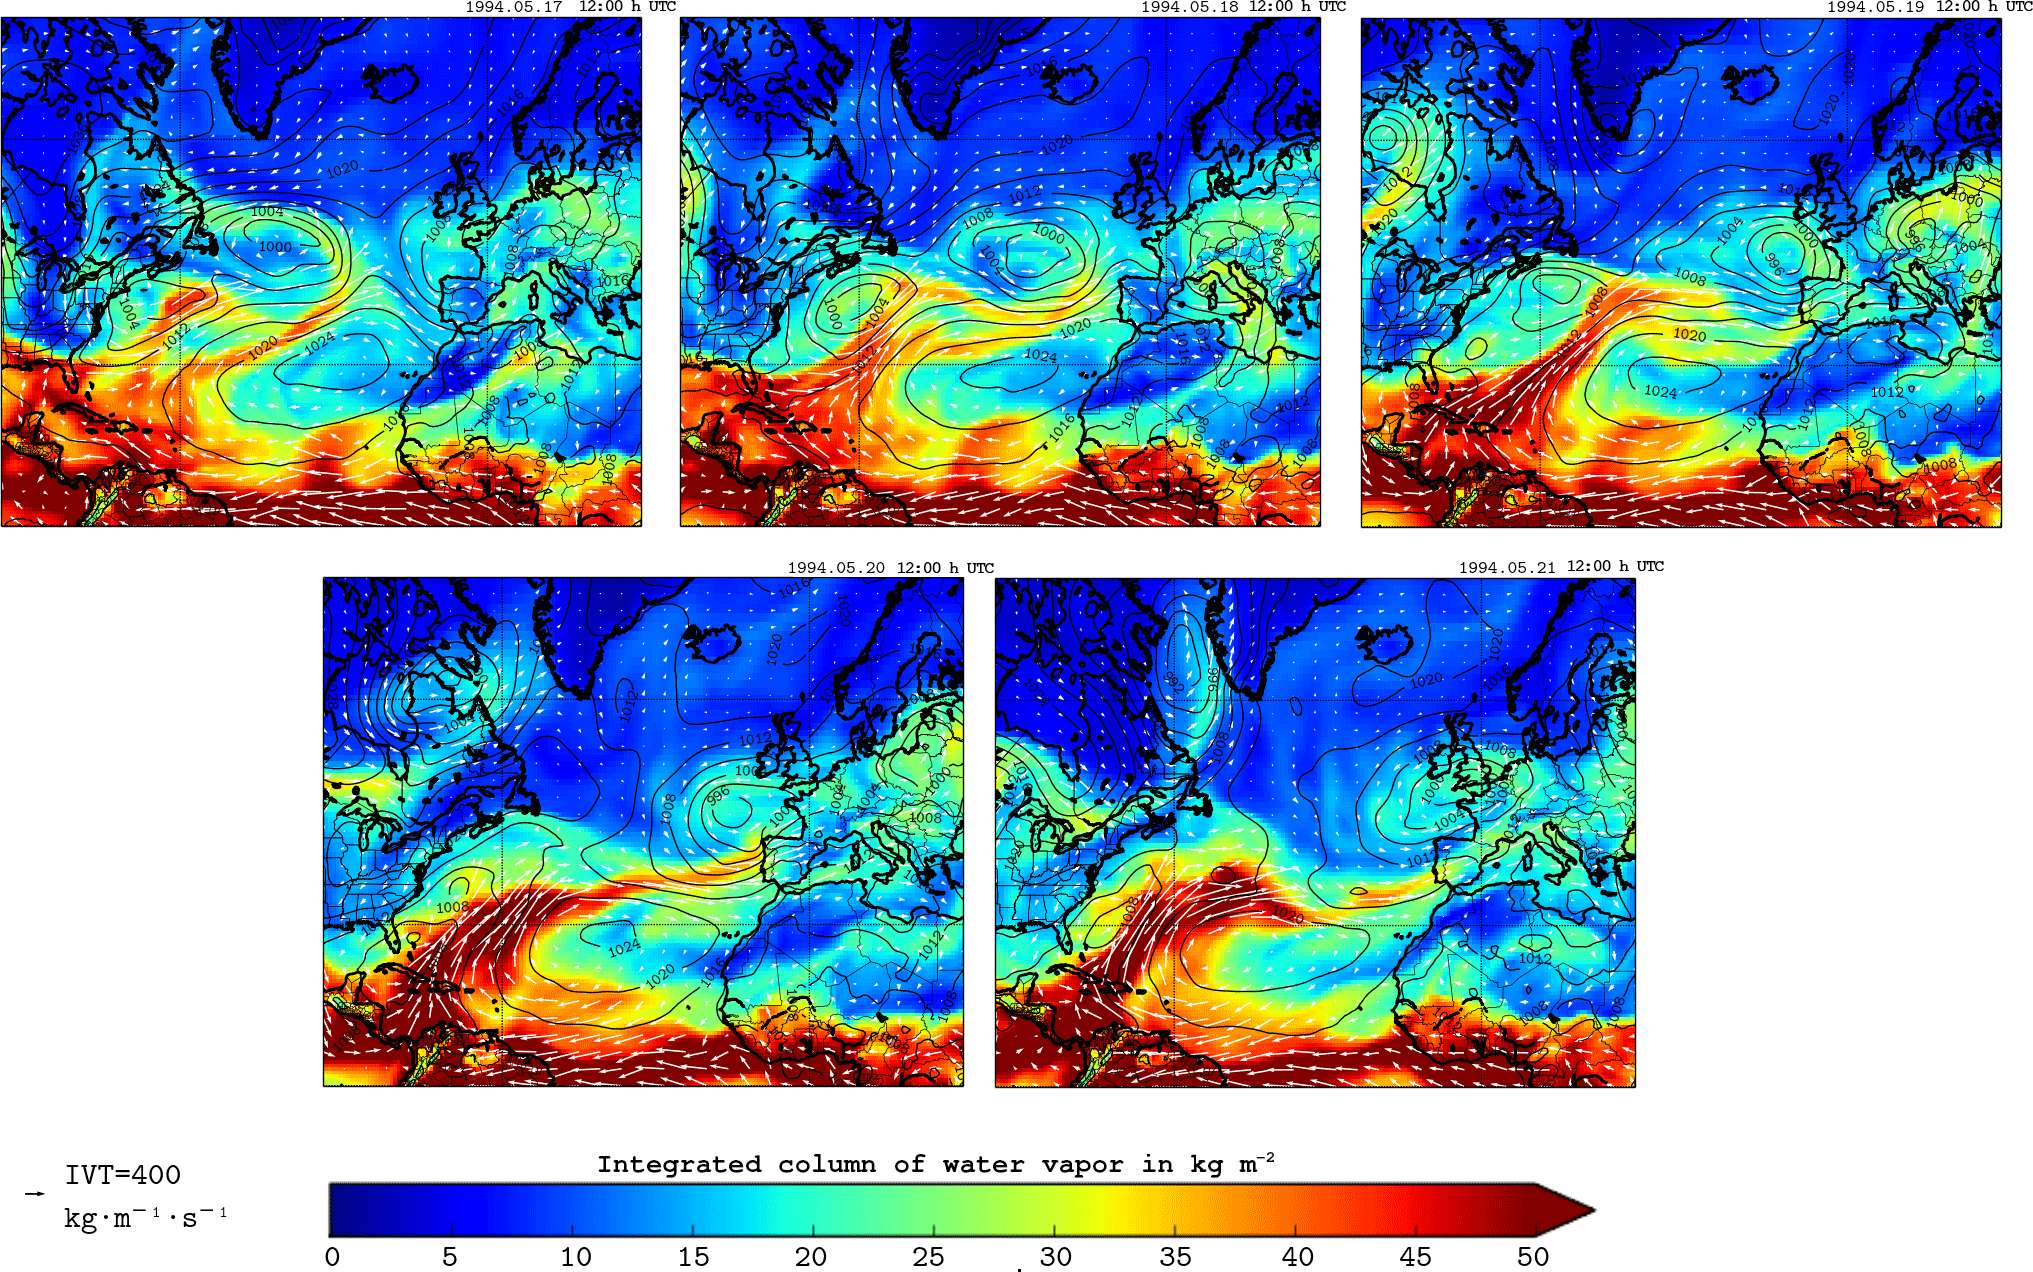
Figure 2Composite analysis of vertically integrated horizontal water vapor transport (IVT; kg m−1 s−1) and the integrated column of water vapor (IWV; kg m−2) derived from the ERA-Interim daily reanalysis dataset for 17–21 May 1994.
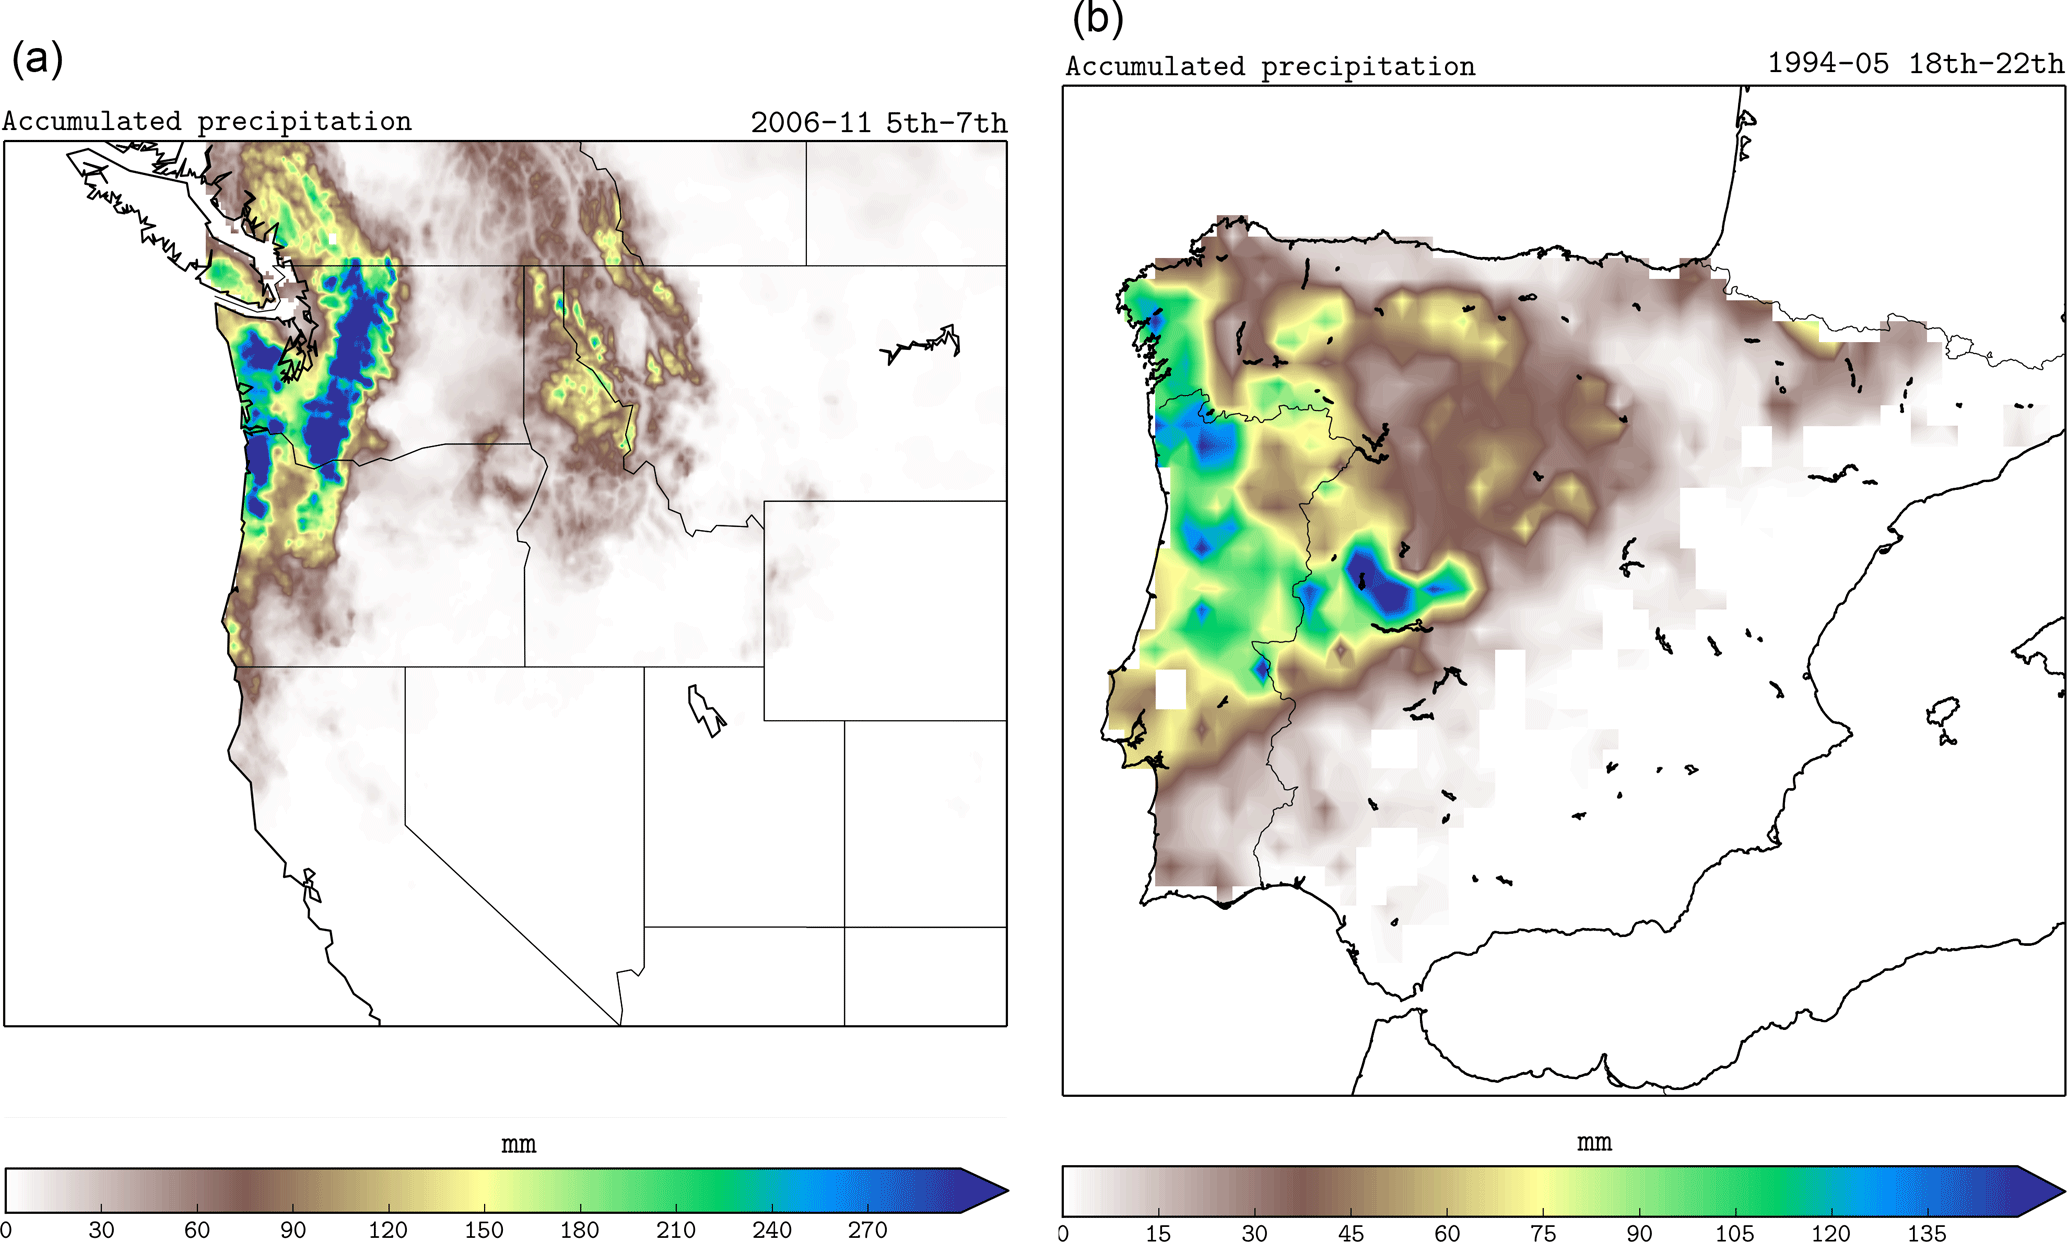
Figure 3Accumulated precipitation for (a) 5–7 November 2006 and (b) 18–22 May 1994 on the western coast of the US and the Iberian Peninsula, respectively. Precipitation datasets were obtained from Livneh et al. (2015), Herrera et al. (2012), and Belo-Pereira et al. (2011).
To analyze the contribution of tropical moisture to the landfalling ARs, different numerical methods have been applied in the last decades, namely analytical, Lagrangian, and Eulerian models (e.g., Gimeno et al., 2012, for a detailed review). Lagrangian models have been widely used in climatic studies of atmospheric water vapor sources and in the diagnosis of the origin of moisture in extreme precipitation events (Gimeno et al., 2010; Ramos et al., 2016; Stohl and James, 2004, 2005). These models, although widely used, cannot correctly describe evaporation (e) and precipitation (p), in addition to neglecting liquid water and ice, which results in an overestimation of both e and p. All Lagrangian models consider constant parcel volumes. However, the initial parcel may change its volume along its pathway due to thermodynamic and mechanical effects. In this case, inertial effects on the parcel should be considered (Maxey and Riley, 1983). Finite-size or inertial particle dynamics in fluid flows can differ markedly from Lagrangian particle dynamics in both their motion and clustering behavior (e.g., Michaelides, 2003, for a review). Eulerian methods, generally known as water vapor tracers (WVTs), are based on coupling a moisture tagging technique with a global or regional meteorological model (Eiras-Barca et al., 2017; Insua-Costa and Miguez-Macho, 2018; Singh et al., 2016). This strategy allows the model to explicitly account for all physical processes affecting atmospheric moisture, but it cannot be run offline and thus cannot be coupled to an atmospheric reanalysis, for example. This paper presents a comparison between the two Lagrangian methods for the landfalling AR episodes on November 2016 and May 1994 described above. Two Lagrangian models will be considered depending on whether inertial forces on tracers are considered or not.
Atmospheric transport has been studied using wind field data retrieved from the European Centre for Medium-Range Weather Forecasts reanalysis, ERA-Interim (Dee et al., 2011). The spatial resolution of the dataset is approximately 80 km (T255 spectral) on 60 vertical levels from the surface up to 0.1 hPa, with a temporal resolution of 6 h. Datasets were retrieved in a longitude–latitude–pressure coordinate system (ϕ, θ, P) on model levels that were translated into a terrain-following coordinate system.
Two types of fluid particles have been considered in this study: inertial and Lagrangian particles. In the first case, the particle volume is assumed to change with time, while the Lagrangian particles keep their volume constant. A Lagrangian particle is then advected using the trajectory equation
where i is the i component of the fluid velocity, and ui is the wind velocity interpolated in space and time from an external source at the particle position xi. Thus, Lagrangian particles follow wind stream trajectories. However, inertial tracers accelerate due to external forces acting on the particle and their motion in nonuniform incompressible flows can be modeled by the momentum equation (Michaelides, 2003; Pérez-Muñuzuri, 2015; Pérez-Muñuzuri and Garaboa-Paz, 2016; Takemura and Magnaudet, 2004; Zapryanov and Tabakova, 1999),
where vi is the velocity of the inertial tracer, ui that of the fluid, Ui = ui − vi the relative velocity between the fluid and the tracer, ωi the fluid vorticity, CL = 0.5 the lift coefficient for a sphere, ρ the air density, ν = μ∕ρ the kinematic viscosity, and Ω the Earth angular velocity. The six terms on the right respectively represent the force exerted by the undisturbed flow, the Coriolis force, the lift force, the Stokes drag, the viscous force, and the history force. In the last two terms, the effect of a spherical tracer with a time-dependent radius R(t) has been considered (Magnaudet and Legendre, 1998; Takemura and Magnaudet, 2004). The derivative D/Dt is taken along the path of a fluid element, whereas the derivative d/dt is taken along the trajectory of the particle.
The instantaneous parcel radius R(t) is calculated from the Rayleigh–Plesset equation (Plesset and Prosperetti, 1977) of parcel dynamics:
Further generalizations of this equation to a compressible fluid (Prosperetti, 1987) have been published, but for the purpose of this study we will keep on a first-order approach, since the bubbly flow is mainly driven by the momentum equation (Eq. 2). In Eq. (3), dR/dt and d2R/dt2 are the parcel wall velocity and acceleration, respectively, Pf is the pressure in the fluid at the parcel interface, and P is the pressure field imposed by the flow. The pressure at the parcel interface is given by
in which the first two terms are the internal pressure of the parcel related to the partial pressure due to vapor content Pv and gas content Pg, respectively, and the last terms account for the interface curvature effect and the viscous stress at the interface. Surface tension is given by γ and for our simulations can be considered negligible γ≈0. The gas pressure inside the parcel changes as the parcel contracts or expands. As the total amount of gas in the tracer remains constant, the tracer radius and gas pressure are related by Pg = , where α = 1 for an isothermal process or is equal to the ratio of specific heats for an adiabatic process. The external P and vapor pressures are interpolated in space and time from the meteorological model at the particle position.
Updrafts and downdrafts due to moist convection were considered for both models. To represent convective transport in a particle dispersion model, it is necessary to redistribute particles in the entire vertical column as these transports are not represented by the ERA-Interim vertical velocity. Here, we follow the same convective parameterization implemented in the FLEXible PARTicle dispersion model (FLEXPART) (Emanuel and Zivkovic-Rothman, 1999; Stohl et al., 2005). Mesoscale wind fluctuations not solved by the ECMWF data are included in Eqs. (1)–(2) as a Gaussian random term with variance equal to the variance of the wind at the grid scale (Stohl et al., 2005).
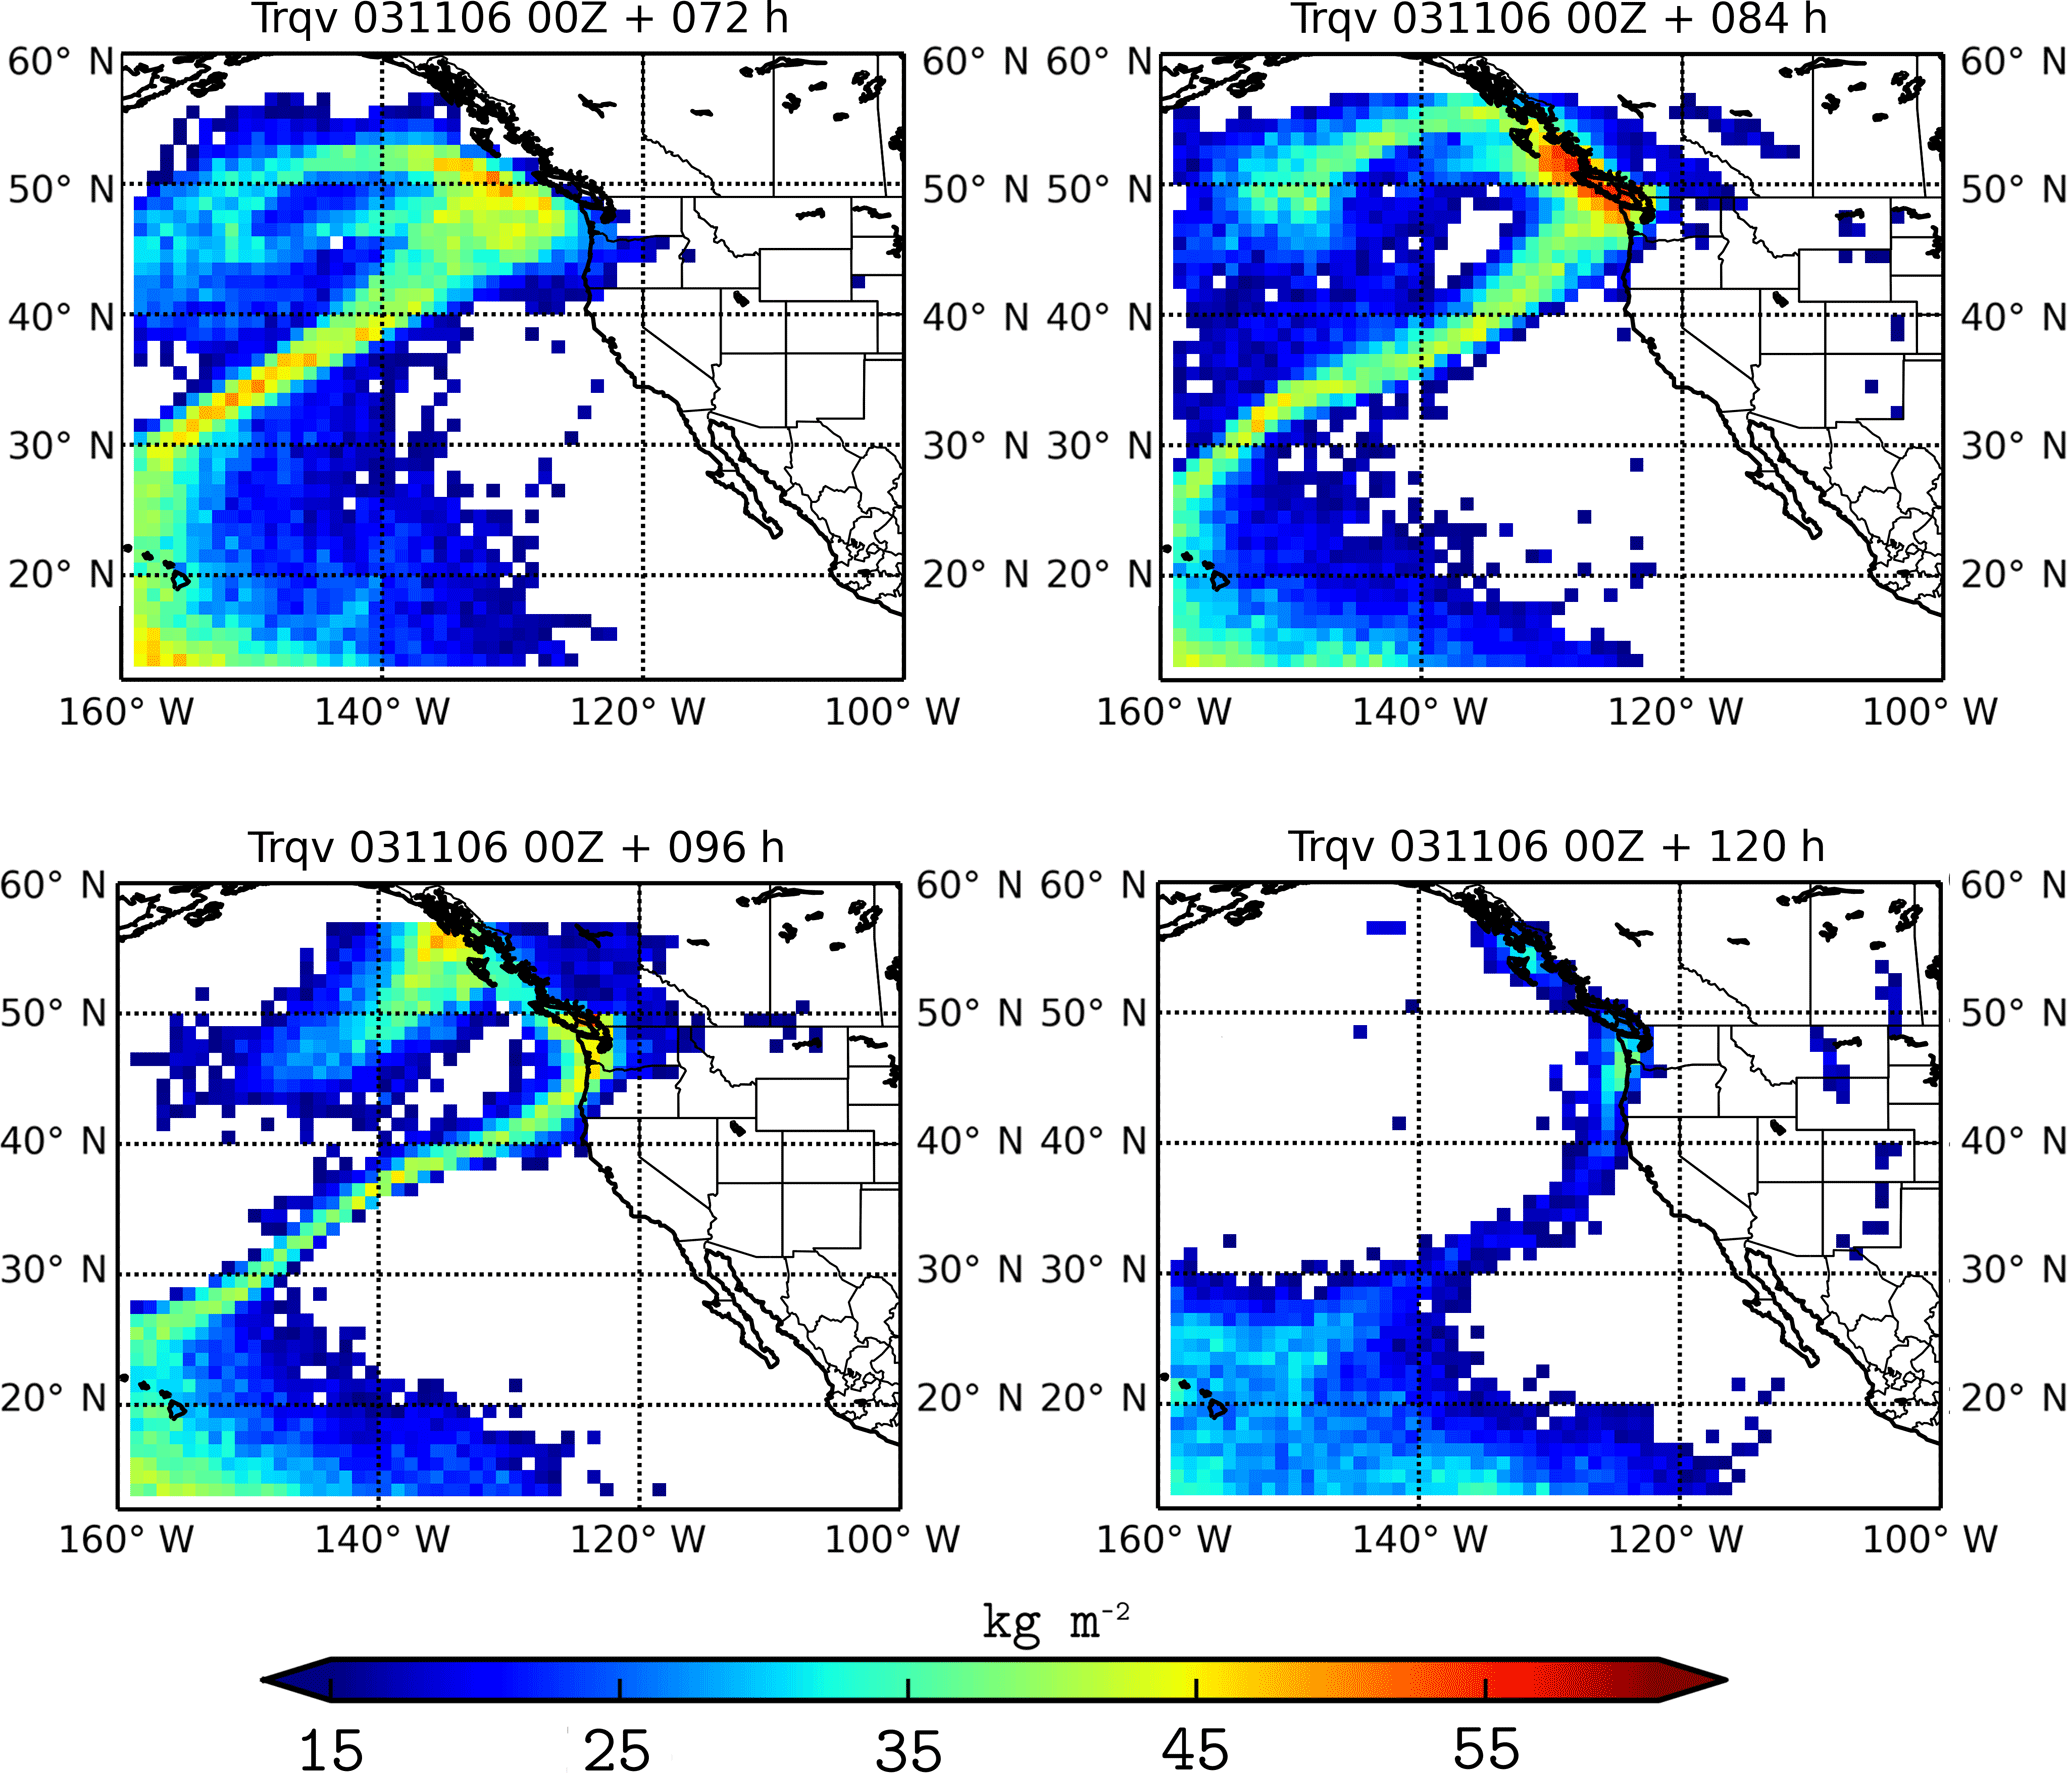
Figure 4Vertically integrated tagged water vapor from the tropics obtained from the inertial model for the November 2006 case. Titles indicate the number of hours that have passed since the beginning of the simulations.
For the numerical experiments, a regular grid of N = 80 × 50 particles is homogeneously distributed in the intervals (θ, ϕ) ∈ [160, 110∘ W] × [7, 30∘ N] (Pacific AR) and (θ, ϕ) ∈ [60, 20∘ W] × [15, 30∘ N] (Atlantic AR) and for 40 vertical levels from the surface up to 15 km above the ground. Then, 3-D Lagrangian simulations have been performed so that particle trajectories are computed by integrating the equations above using a fourth-order Runge–Kutta scheme with a fixed time step of Δt = 300 s and multilinear interpolation in time and space from current 60-level ECMWF data. Particles are advected during 120 h beginning 3 November 2006 (Pacific AR) and 16 May 1994 (Atlantic AR) at 00:00 UTC, and every 6 h a new grid of particles is released from the original location. The history term in Eq. (2) is integrated following the numerical integration scheme depicted by Daitche (2013).
To study the trajectory followed by a tagged mass of vapor, an initial volume of radius R0 = 5 m was used. Different R0 values ranging from 1 to 500 m were also considered without significantly affecting the results shown below. By decreasing the tracer radius, the inertial effects diminish and the results approach those of the Lagrangian particles. Initially, a specific humidity is assigned to each inertial or Lagrangian particle. The net change in water vapor content is given by
where m is the mass of a particle, and e − p measures the net excess or shortage of water vapor at the particle position. For the inertial tracers, the volume of the particle changes with time, while m is constant for the Lagrangian particles. At any time, we assume that the water vapor and temperature of the particles are equal to the surrounding values interpolated from ERA-Interim at the tracer position = qv(t). Also, the water vapor content inside the particle is equal to the tagged humidity plus some moisture up to qv, = + . For t = 0, = 0) = = 0) and = 0) = 0. Integration of Eq. (5) results in a decrease in the tagged moisture only when the water vapor excess ε = qv(t − Δt) − qv(t) is positive:
where m = ρV(t) for an inertial particle, and the last term represents the percentage of moisture reduction for the tagged water vapor. Otherwise, if ε ≤ 0 the tagged moisture does not change.
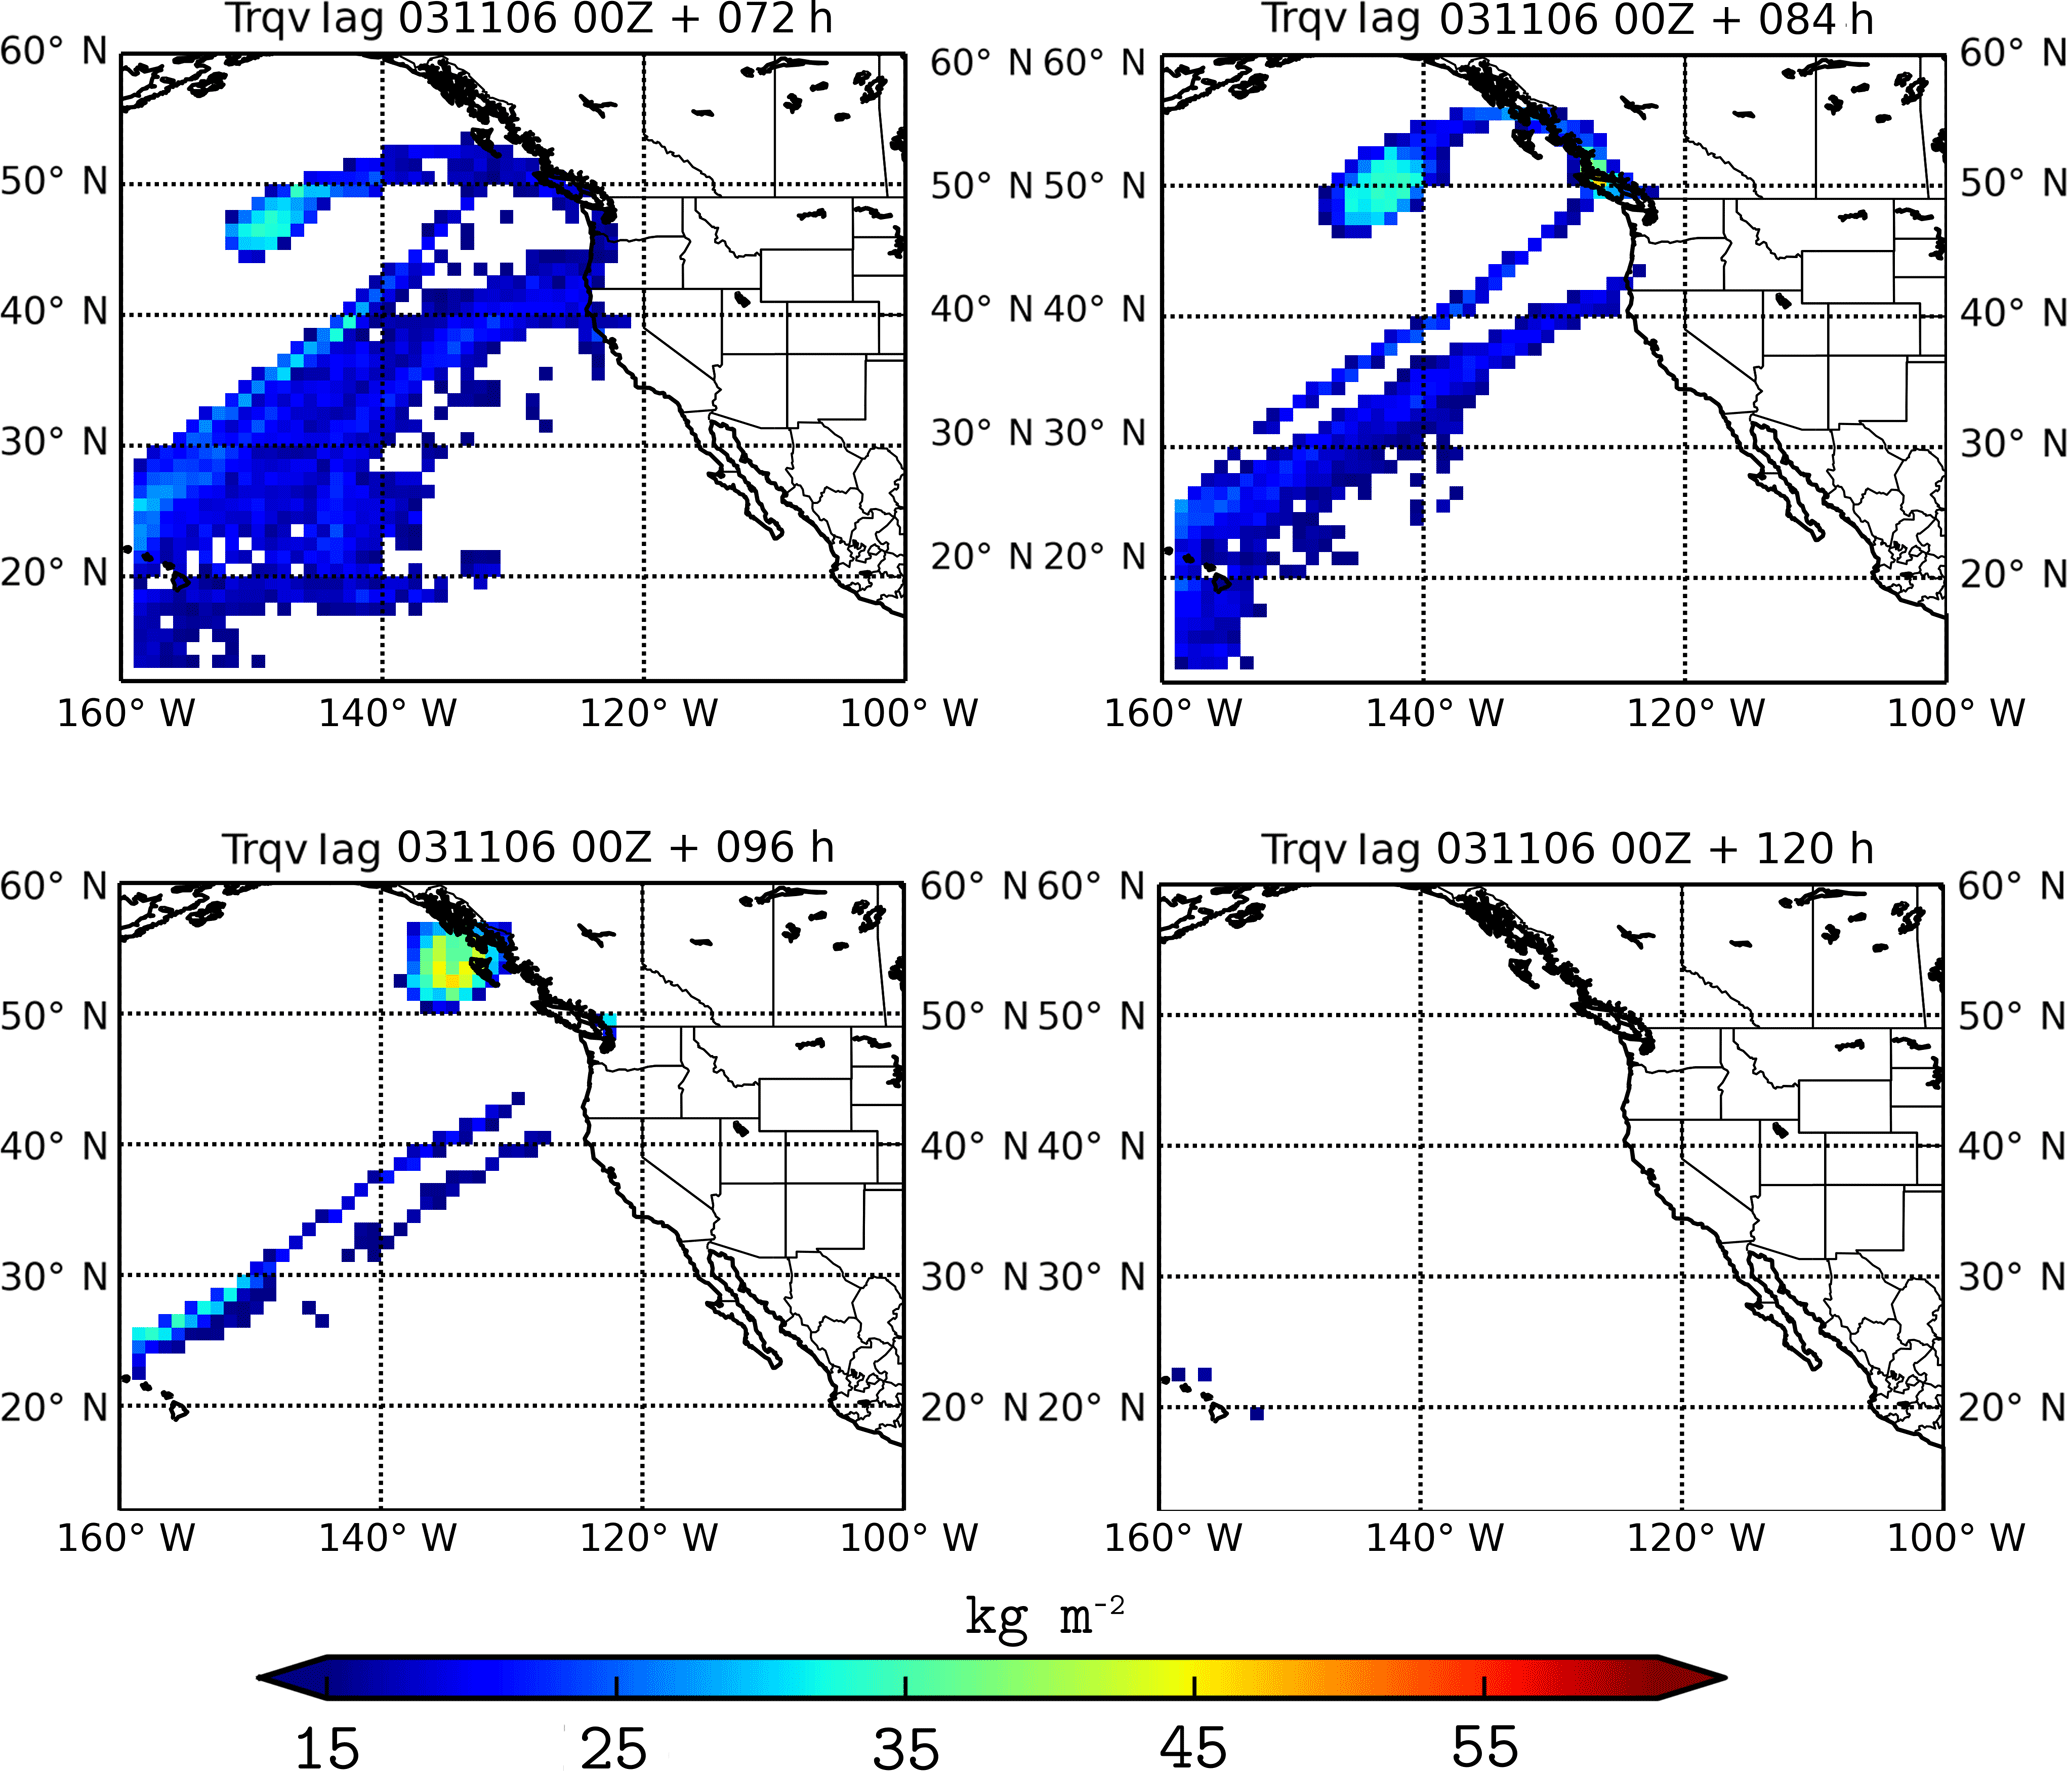
Figure 5Vertically integrated tagged water vapor from the tropics obtained from the Lagrangian model for the November 2006 case. Titles indicate the number of hours that have passed since the beginning of the simulations.
Tagged moisture advected from the tropics and simulated with both Lagrangian models is shown in Figs. 4–9. For the Pacific case, the integrated water vapor shows an intense plume of moisture extending from the tropical water vapor reservoir to Washington and Oregon as was shown in the reanalysis; see Fig. 1. Landfalling of the AR occurs 6 November at 00:00 UTC. During the next hours moisture continues to reach the continent, displacing to the south and reaching northern California. Inertial and Lagrangian tagged tracers are initially trapped by the vortical structure of the depression located northward of the AR that drags them while moving northeastern (see Fig. 1 for a time sequence). Compared to Lagrangian particles, a crowded cloud of inertial particles loaded with moisture is observed around the depression. The AR is well defined for the inertial model, while the pure Lagrangian one seems to quickly lose the tagged moisture from the tropics. Note that 120 h after being initialized, tagged inertial particles reach northern California favored by the northward turn of the low as observed in the IVT analysis, but not the Lagrangian ones. Tagged inertial particles can also be observed inland north of Montana 84 and 96 h after initialization and in the north of the British Columbia coast, while this is not the case for the Lagrangian tracers (IVT images also show some moisture at the same locations). The extreme nature of the November 2006 precipitation event (Fig. 3) is reflected in the extreme values of the tagged moisture content over the North Pacific coast (see, for example, the panel corresponding to 84 h in Fig. 4).
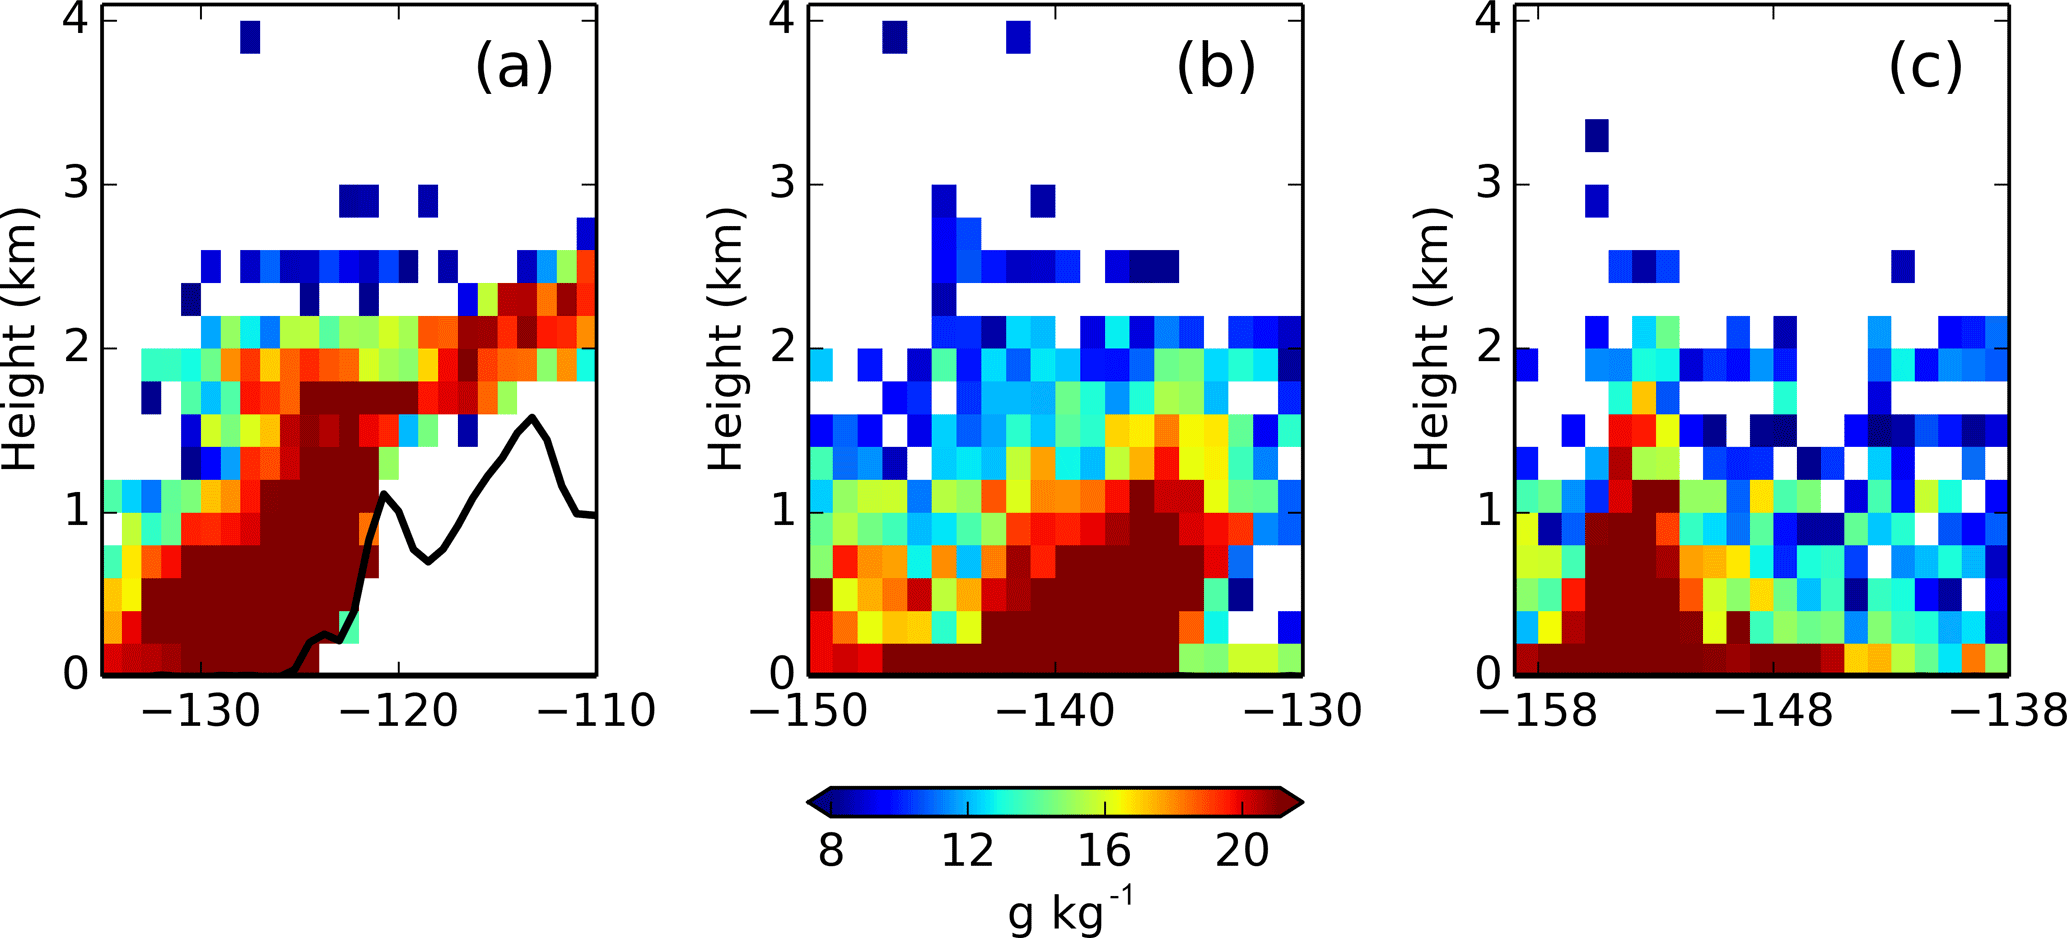
Figure 6Transversal cross sections along the central axis of the atmospheric river in the Pacific basin at latitudes 48 (a), 38 (b), and 30 (c) for 6 November, 12:00 UTC. The plots show the tagged inertial water vapor tracers qv in g kg−1. The solid line in (a) corresponds to the topography profile.
The vertical distribution of water vapor from the tropics along the inertial AR is shown in Fig. 6. In the root of the AR, most of the tropical moisture remains close to surface, while for the leading edge, the humidity tends to ascend in the vertical column. Once the AR reaches the Pacific coast the tagged water vapor ascends due to the topography, and the moisture content diminishes inland as precipitation develops. These results are in agreement with those obtained by Eiras-Barca et al. (2017).
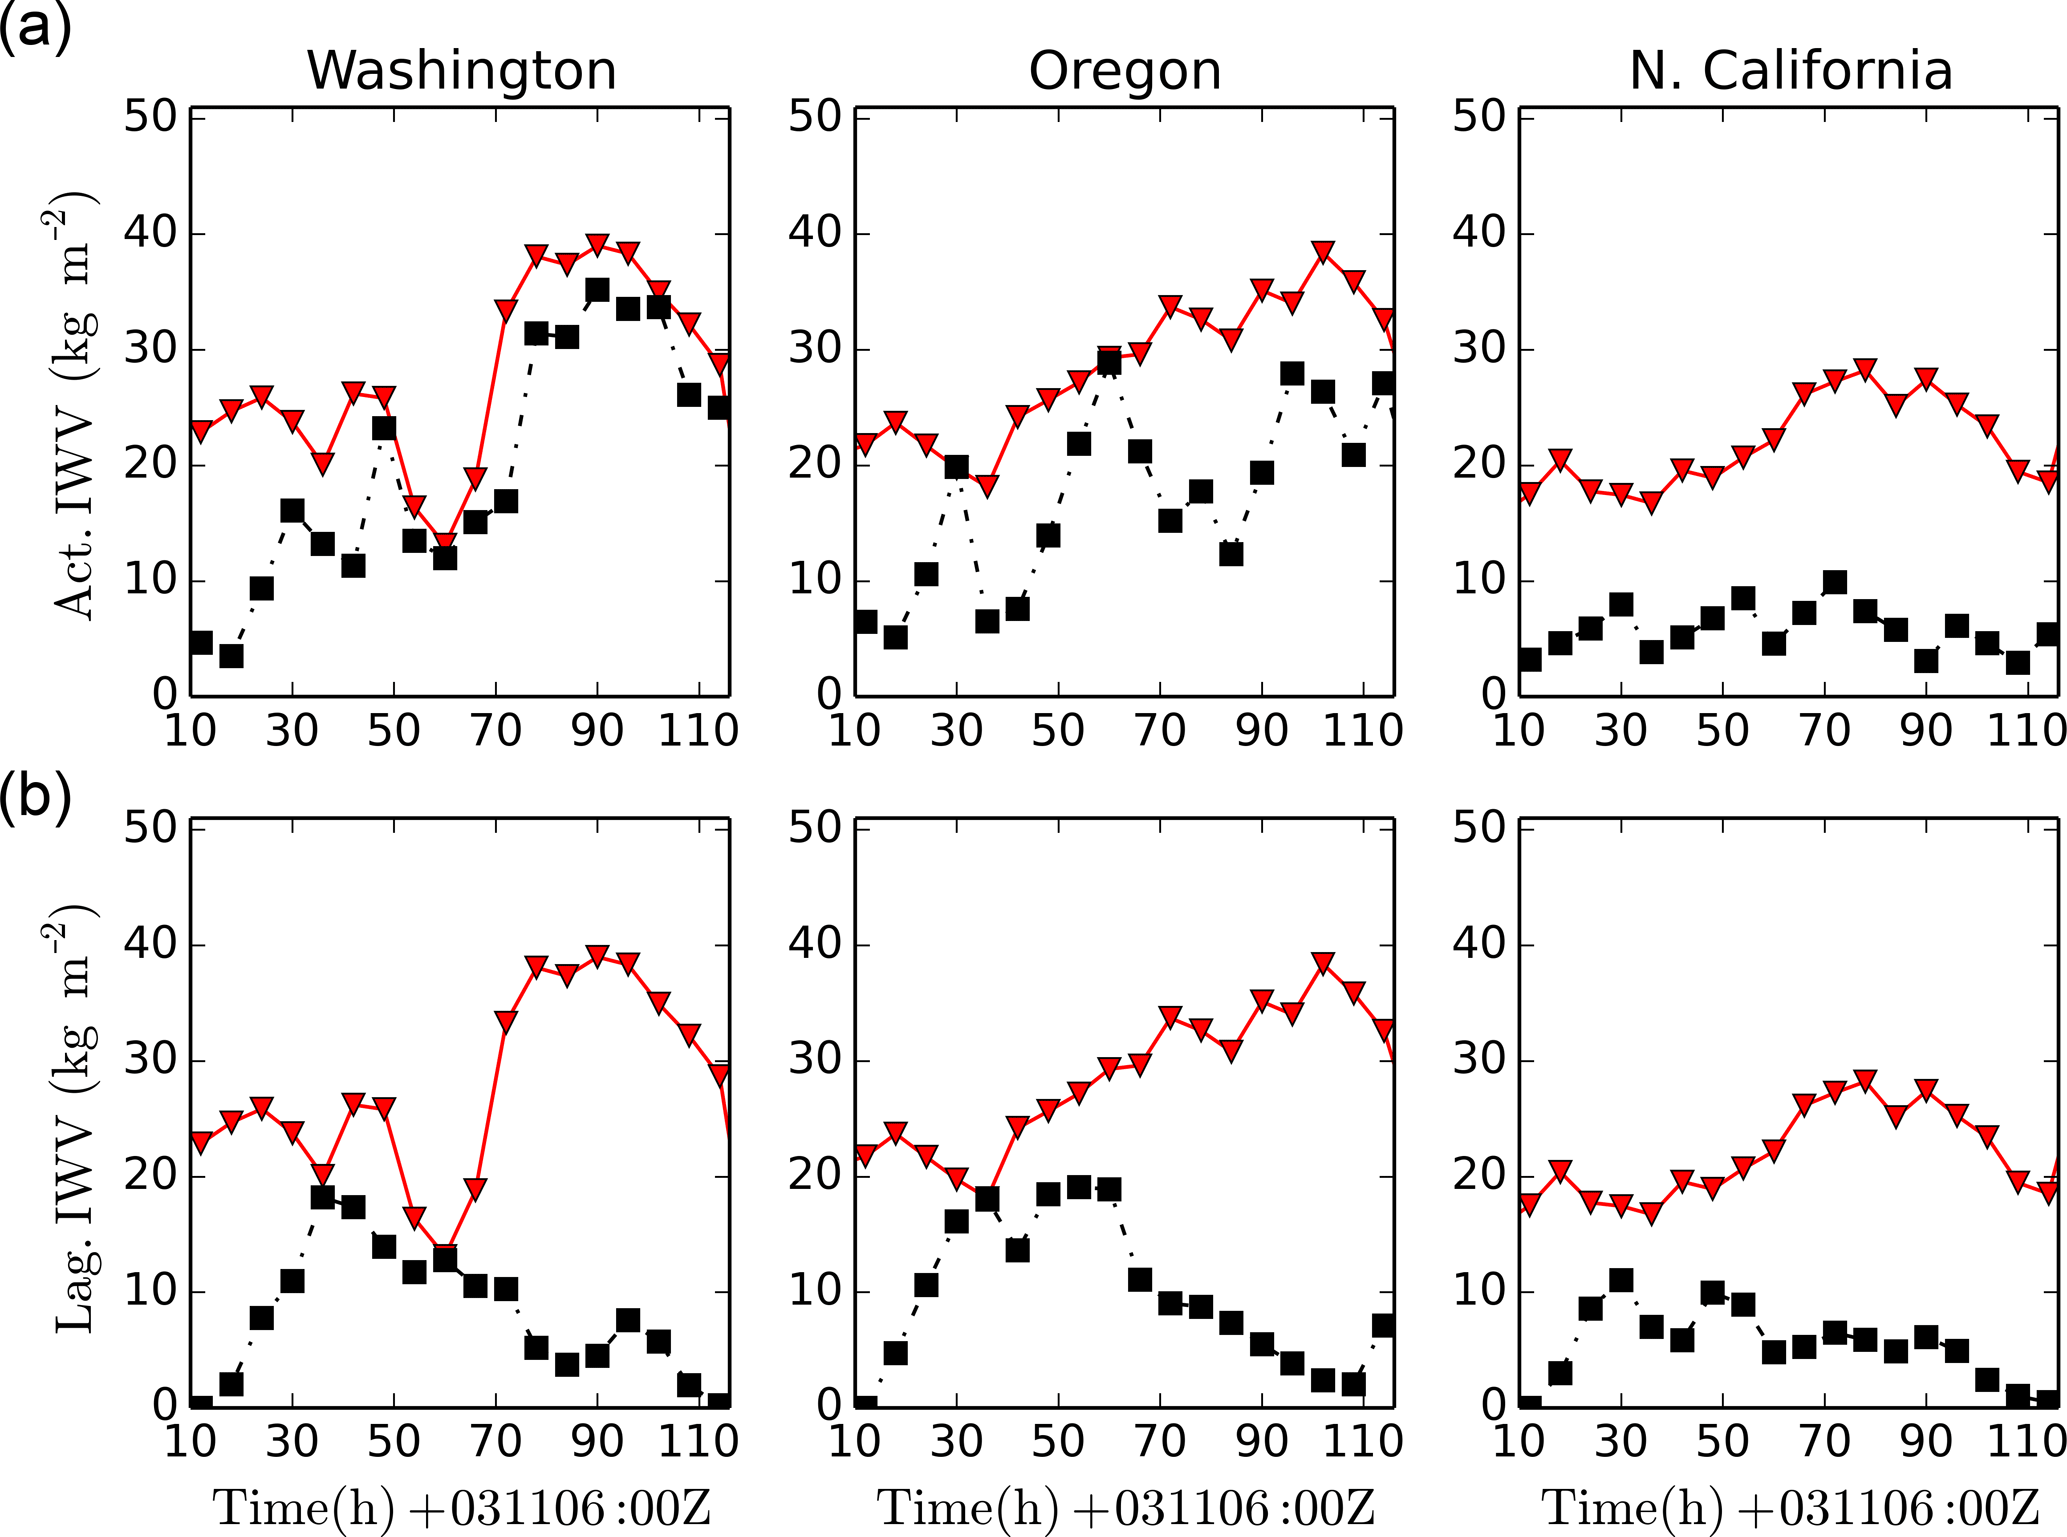
Figure 7Time evolution of the tagged vertically integrated moisture concentration for three sites on the northeastern coast of the US compared to the IWV obtained from the analysis (red triangles) for the November 2006 case. Inertial (a) and Lagrangian (b) tracers.
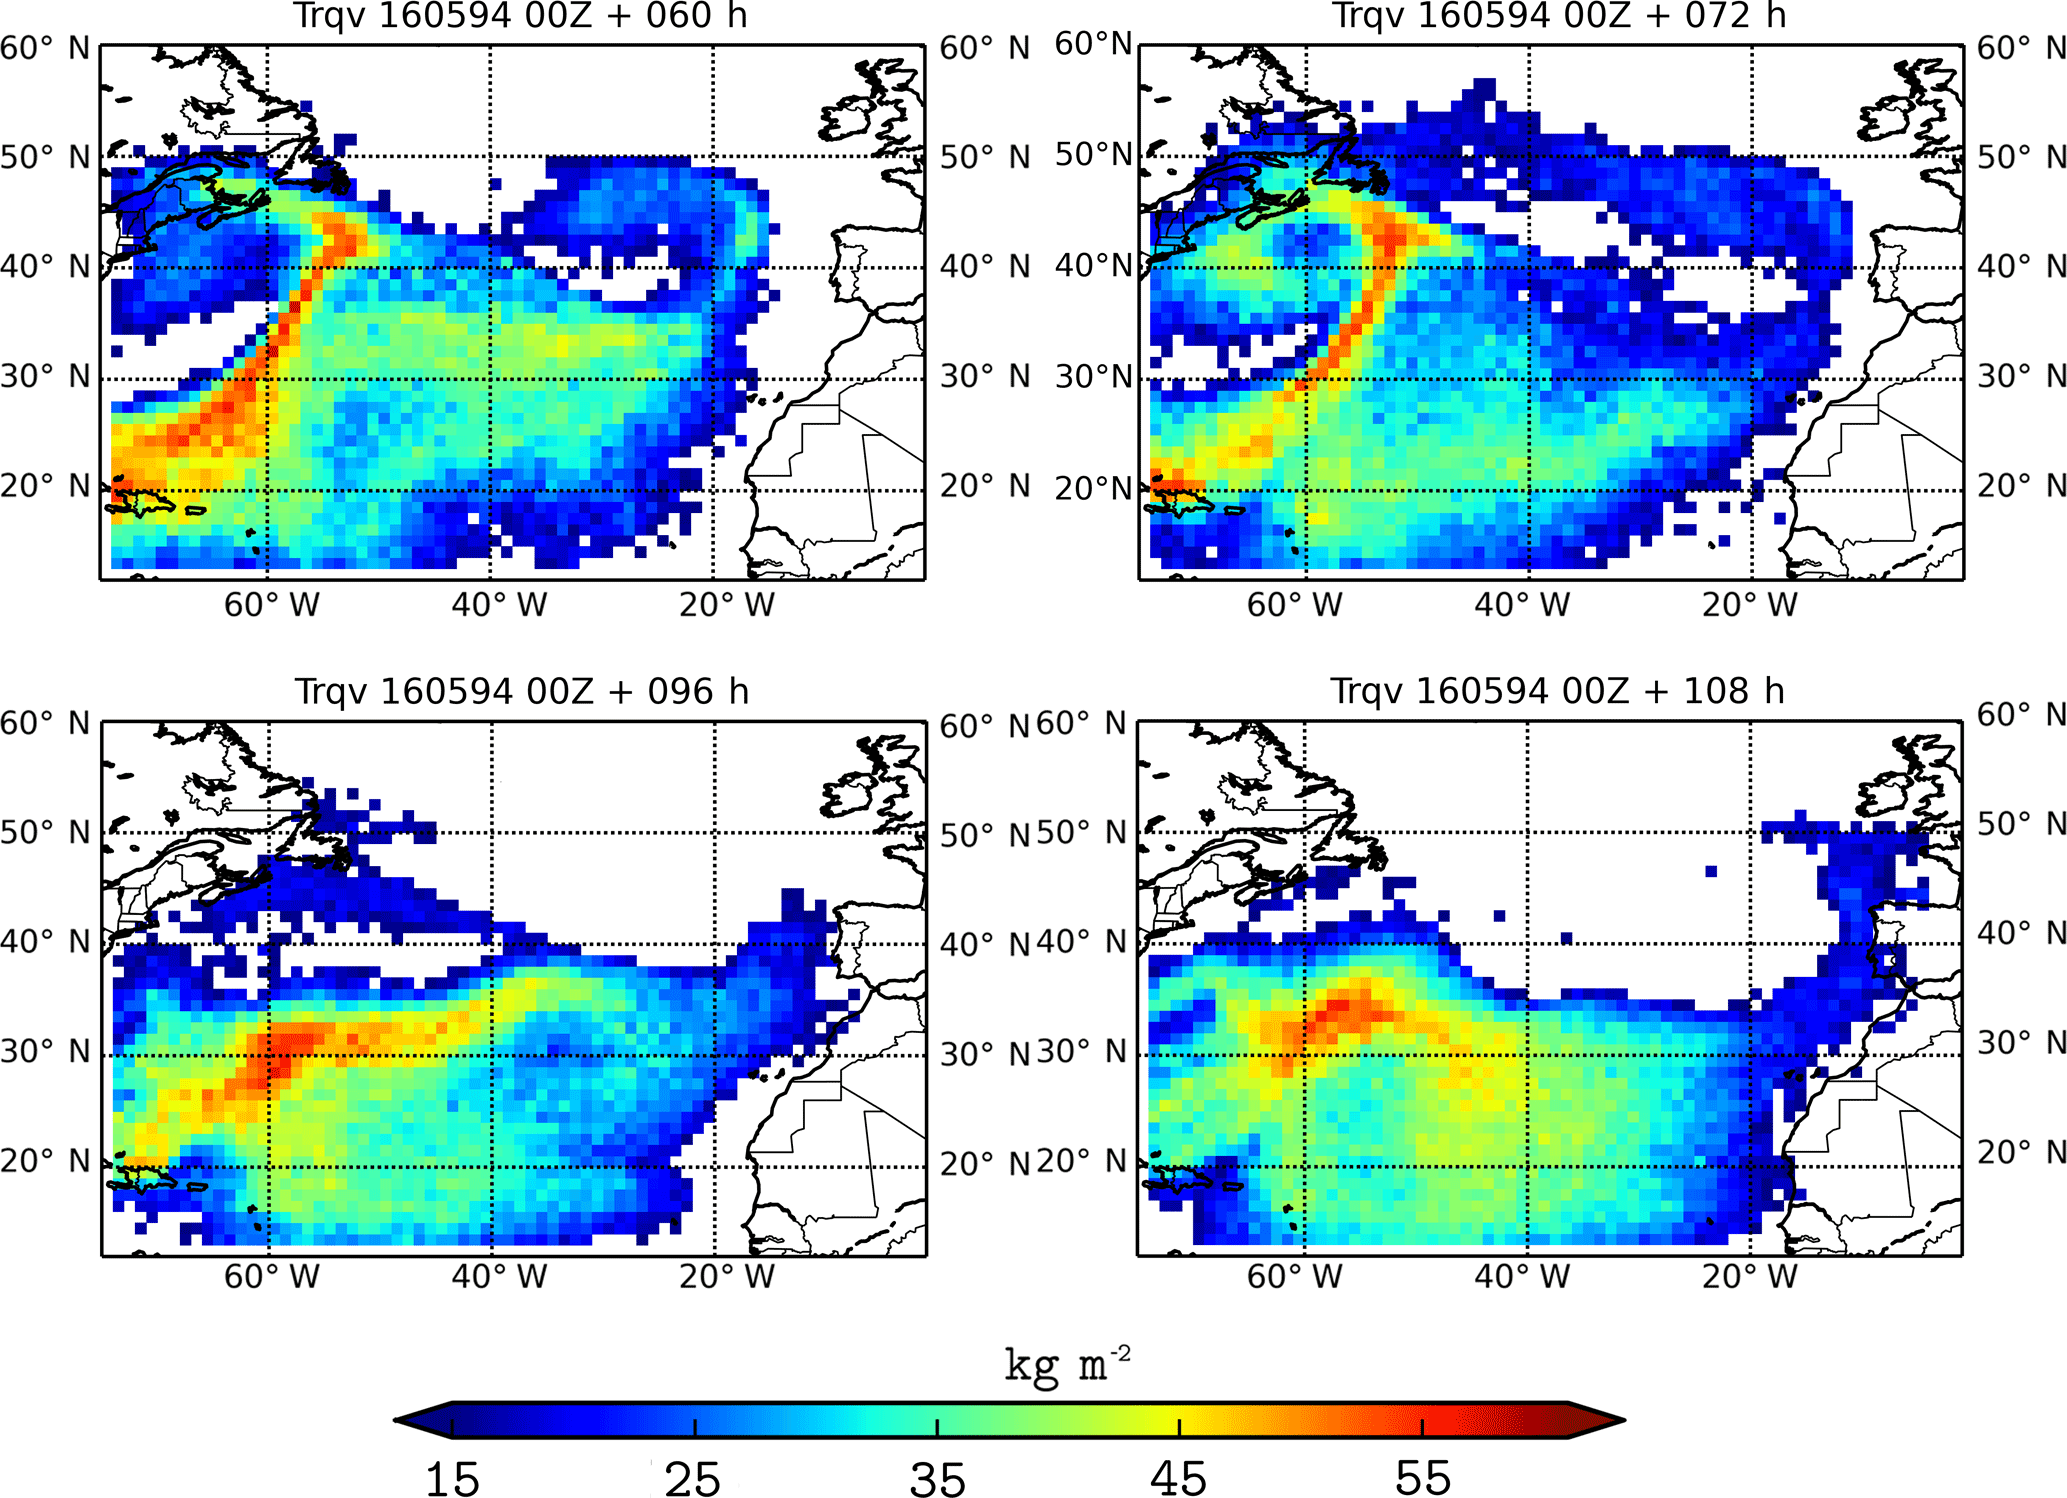
Figure 8Vertically integrated tagged water vapor from the tropics obtained from the inertial model for the May 1994 case. Titles indicate the number of hours that have passed since the beginning of the simulations.
Figure 7 resumes the temporal behavior of both inertial and Lagrangian moisture contents over three sites located on the coasts of Washington, Oregon, and northern California, respectively, compared to the IWV from the analysis. As mentioned above, the tagged vapor content of the inertial tracers fits well to the moisture content time series obtained from the analysis as the AR approaches Washington, and the trend is reproduced in the southern locations in Oregon and northern California. However, the simulated concentration values are smaller in these two regions. On the other hand, the Lagrangian particle moisture content increases rapidly with time, reaching a maximum at approximately 40 h after initialization, and decreases to zero for the end of the simulation.
The next case study corresponds to an atmospheric river observed in 1994 landfalling in the western Iberian Peninsula on 20 May. Figures 8–9 reproduce the AR trajectory over the Atlantic ocean. The IWV analysis shown previously demonstrates the presence of two moisture branches reaching the Iberian Peninsula one after the other. This is observed in both Lagrangian simulations; the first branch of the AR reaches Iberia approximately 72 h after initialization (19 May), while the second one landfalls the Peninsula on 20 May at 00:00 UTC. As was observed in the previous case, the shape of the Lagrangian AR is more disintegrated than for the inertial simulations. In both cases, for the first hours of simulation, the presence of a depression located northward of the plume (30∘ W, 40∘ N) drags the particles towards the Iberian Peninsula. At the same time, a smaller depression (60∘ W, 43∘ N) curls the tagged particles (second branch of the AR) reaching the Labrador Peninsula. The anticyclone in the middle of the Atlantic Ocean, clearly visible in the IWV images for 20 May at 12:00 UTC, is also reproduced as the inertial tagged particles curl around its center. Although the shape of the AR is clearly visible for both Lagrangian simulations, the amount of moisture content that reaches Iberia is smaller than for the Pacific case previously analyzed. This translated into lower precipitation rates.
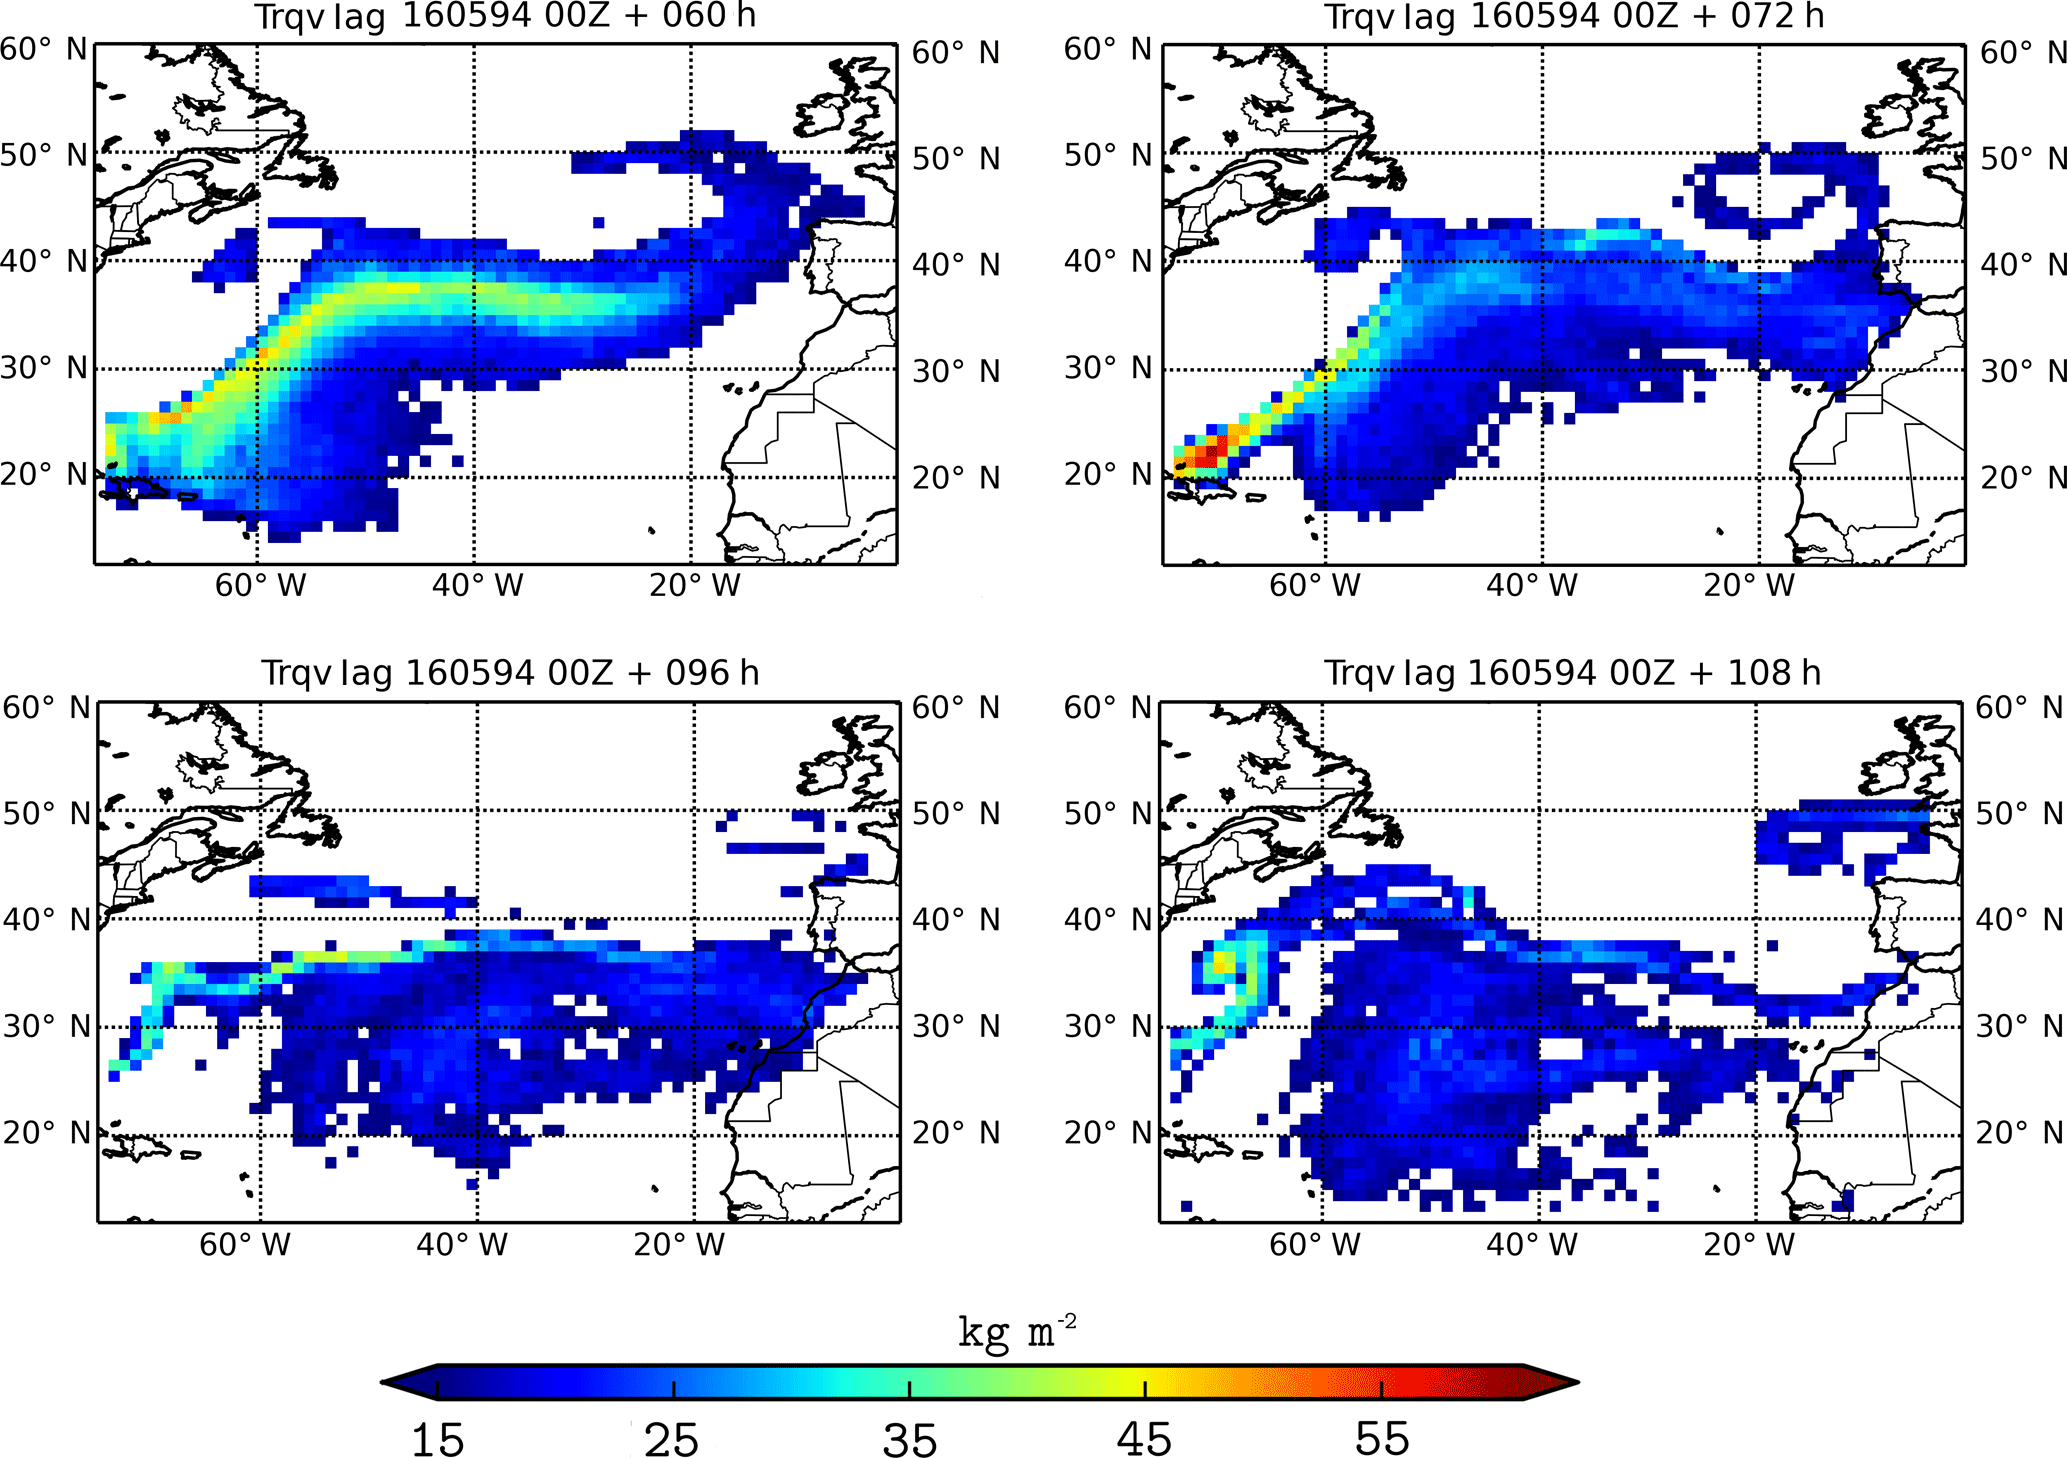
Figure 9Vertically integrated tagged water vapor from the tropics obtained from the Lagrangian model for the May 1994 case. Titles indicate the number of hours that have passed since the beginning of the simulations.
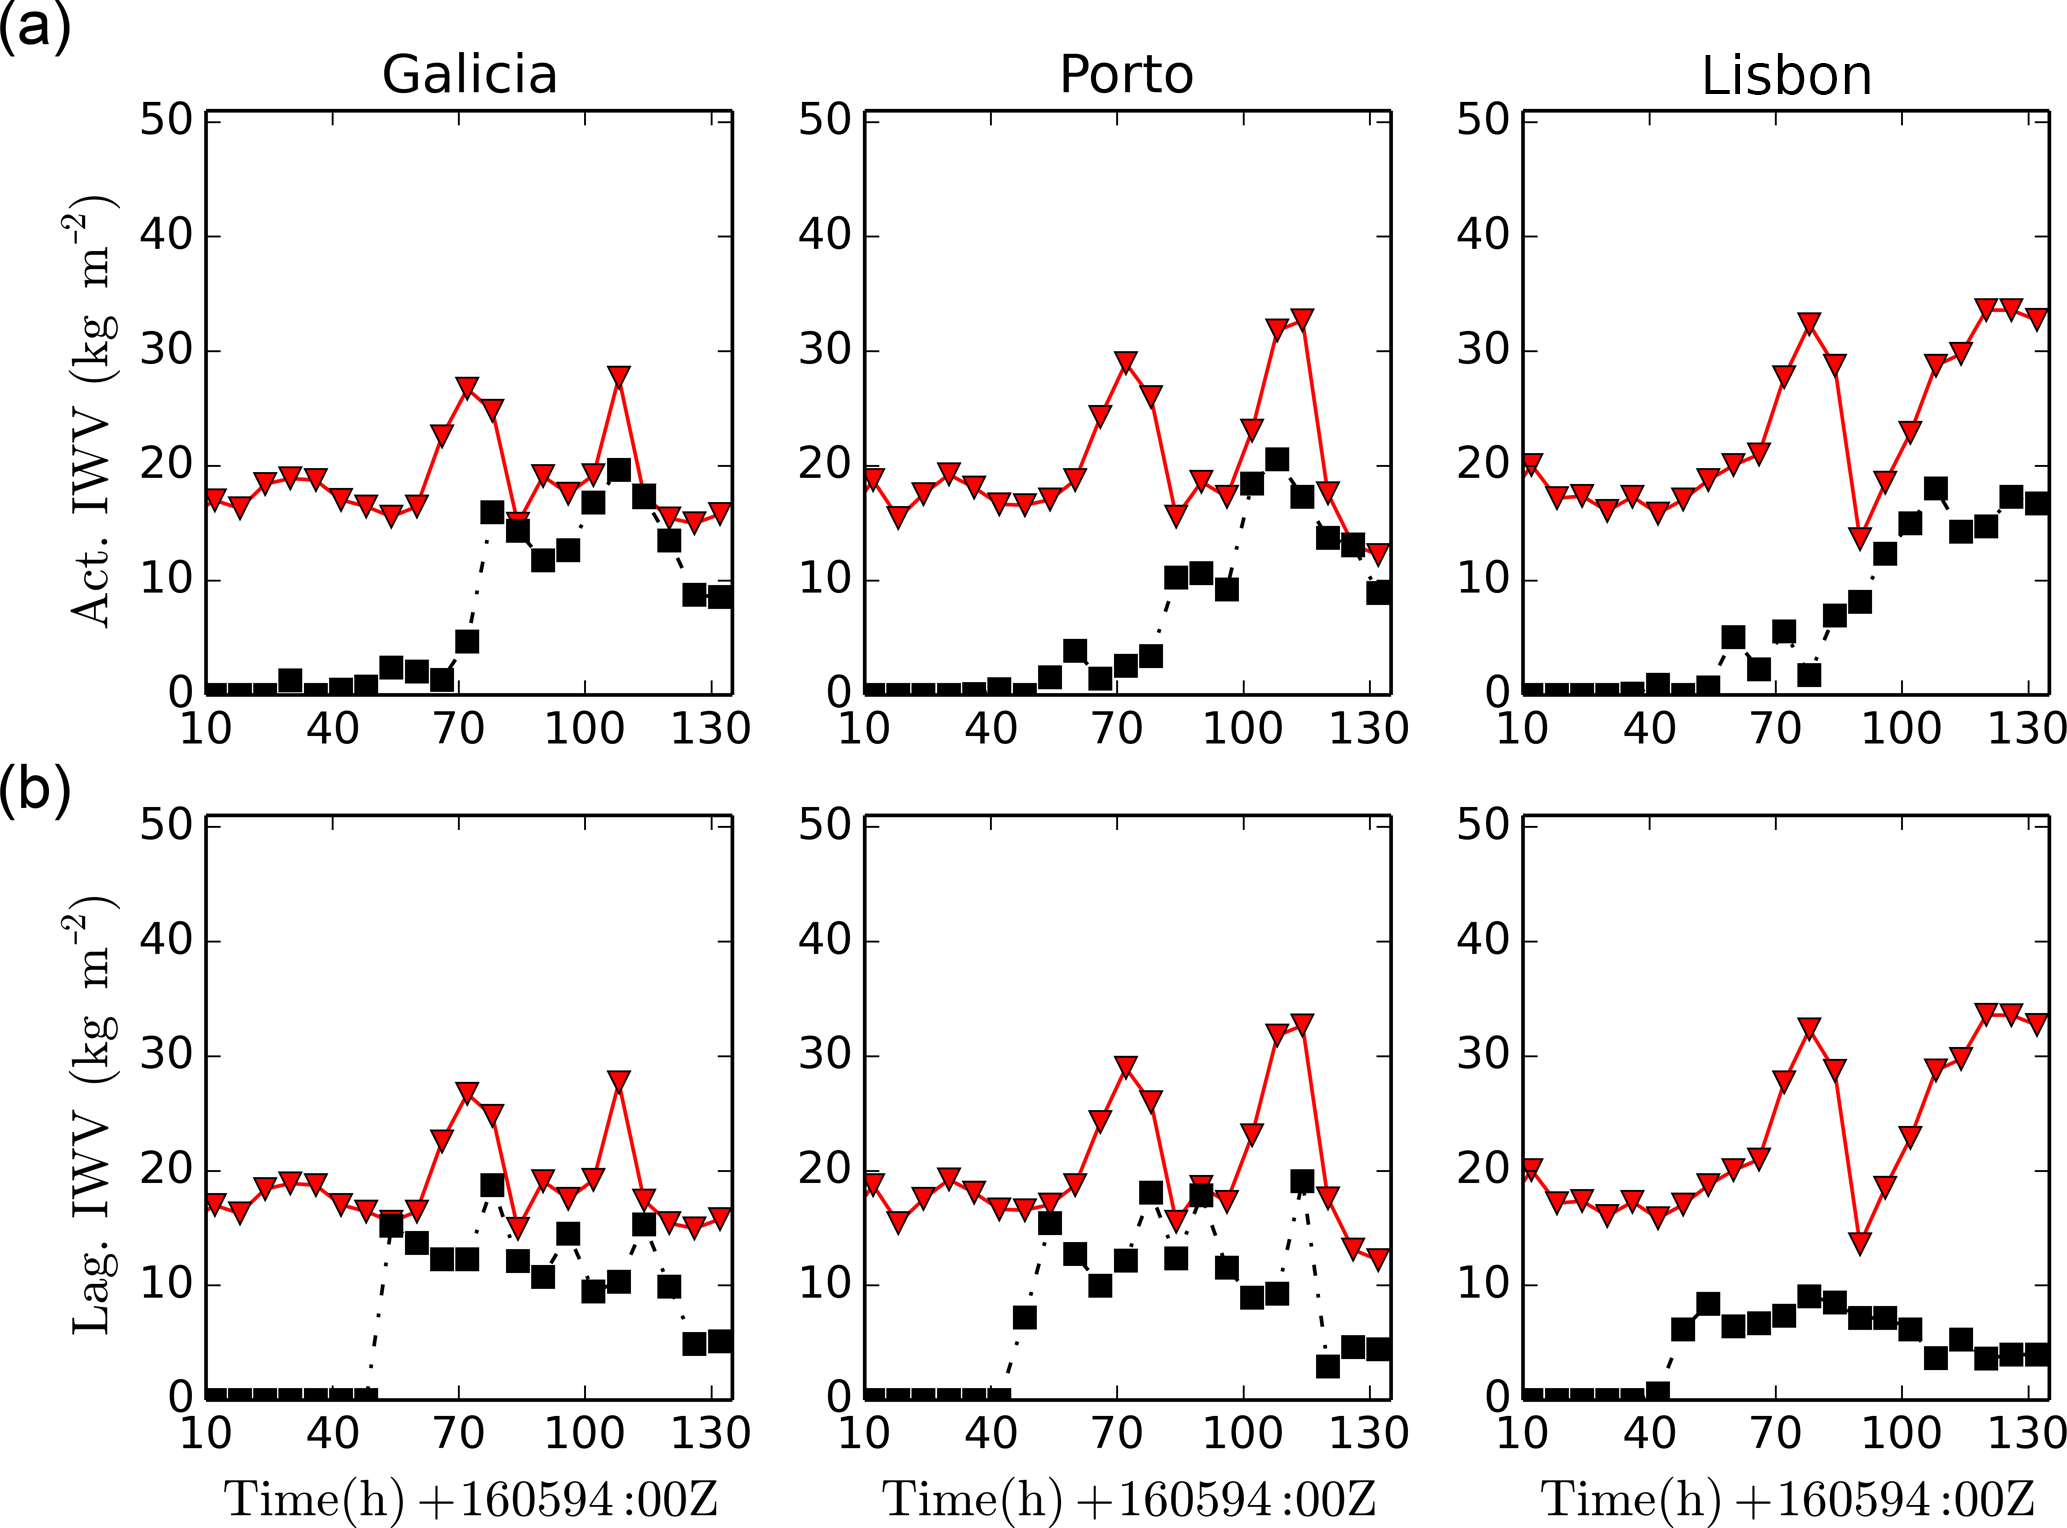
Figure 10Time evolution of the tagged vertically integrated moisture concentration for three coastal sites in the western Iberian Peninsula compared to the IWV obtained from the analysis (red triangles) for the May 1994 Atlantic case. Inertial (a) and Lagrangian (b) tracers.
The time evolution of the tagged vertically integrated moisture concentration is shown in Fig. 10 for three coastal sites located in the west of the Iberian Peninsula. Both AR branches described earlier are clearly visible from the IVW analysis data (triangles and red line) as local maxima of the moisture time series. Both peaks are delayed as the AR slides to the south from Galicia (NW Spain) to Lisbon. Inertial particle simulation reproduces the second peak and its evolution well, although the moisture content for the Lisbon site is smaller than observed. However, the Lagrangian tracers reach the three sites for the first and second peak of the AR landfall, but not in intensity, and the moisture content values obtained for the Lisbon site are smaller than for the inertial case.
In both case studies, we note that for those tagged tracers reaching the continent, their vapor content diminishes due to orographic ascent leading to precipitation extremes, which is enhanced for the Pacific case when compared to the Atlantic one. Only for the Pacific region were some tracers observed inland (Montana and western Canada) due to the high moisture and strong wind values observed in the simulations. On the other hand, we observed that inertial tracers keep their water vapor content longer than the Lagrangian ones near the low-pressure areas.
The effect of tracer contraction and expansion is analyzed in Fig. 11 for both cases. To that end, the vertically integrated ratio R(t)∕R0 is represented for the same AR positions shown in Figs. 4–8. Note that the largest tracer volumes correspond to the highest values of the moisture content due to uplift motions of the tracers inside the ARs and the tropic region. On the other hand, the tracer volume rapidly decreases to zero inland due to the loss of water vapor as precipitation takes place. Maximum volume values are attained near the Pacific coast as observed in the qv profiles described above.
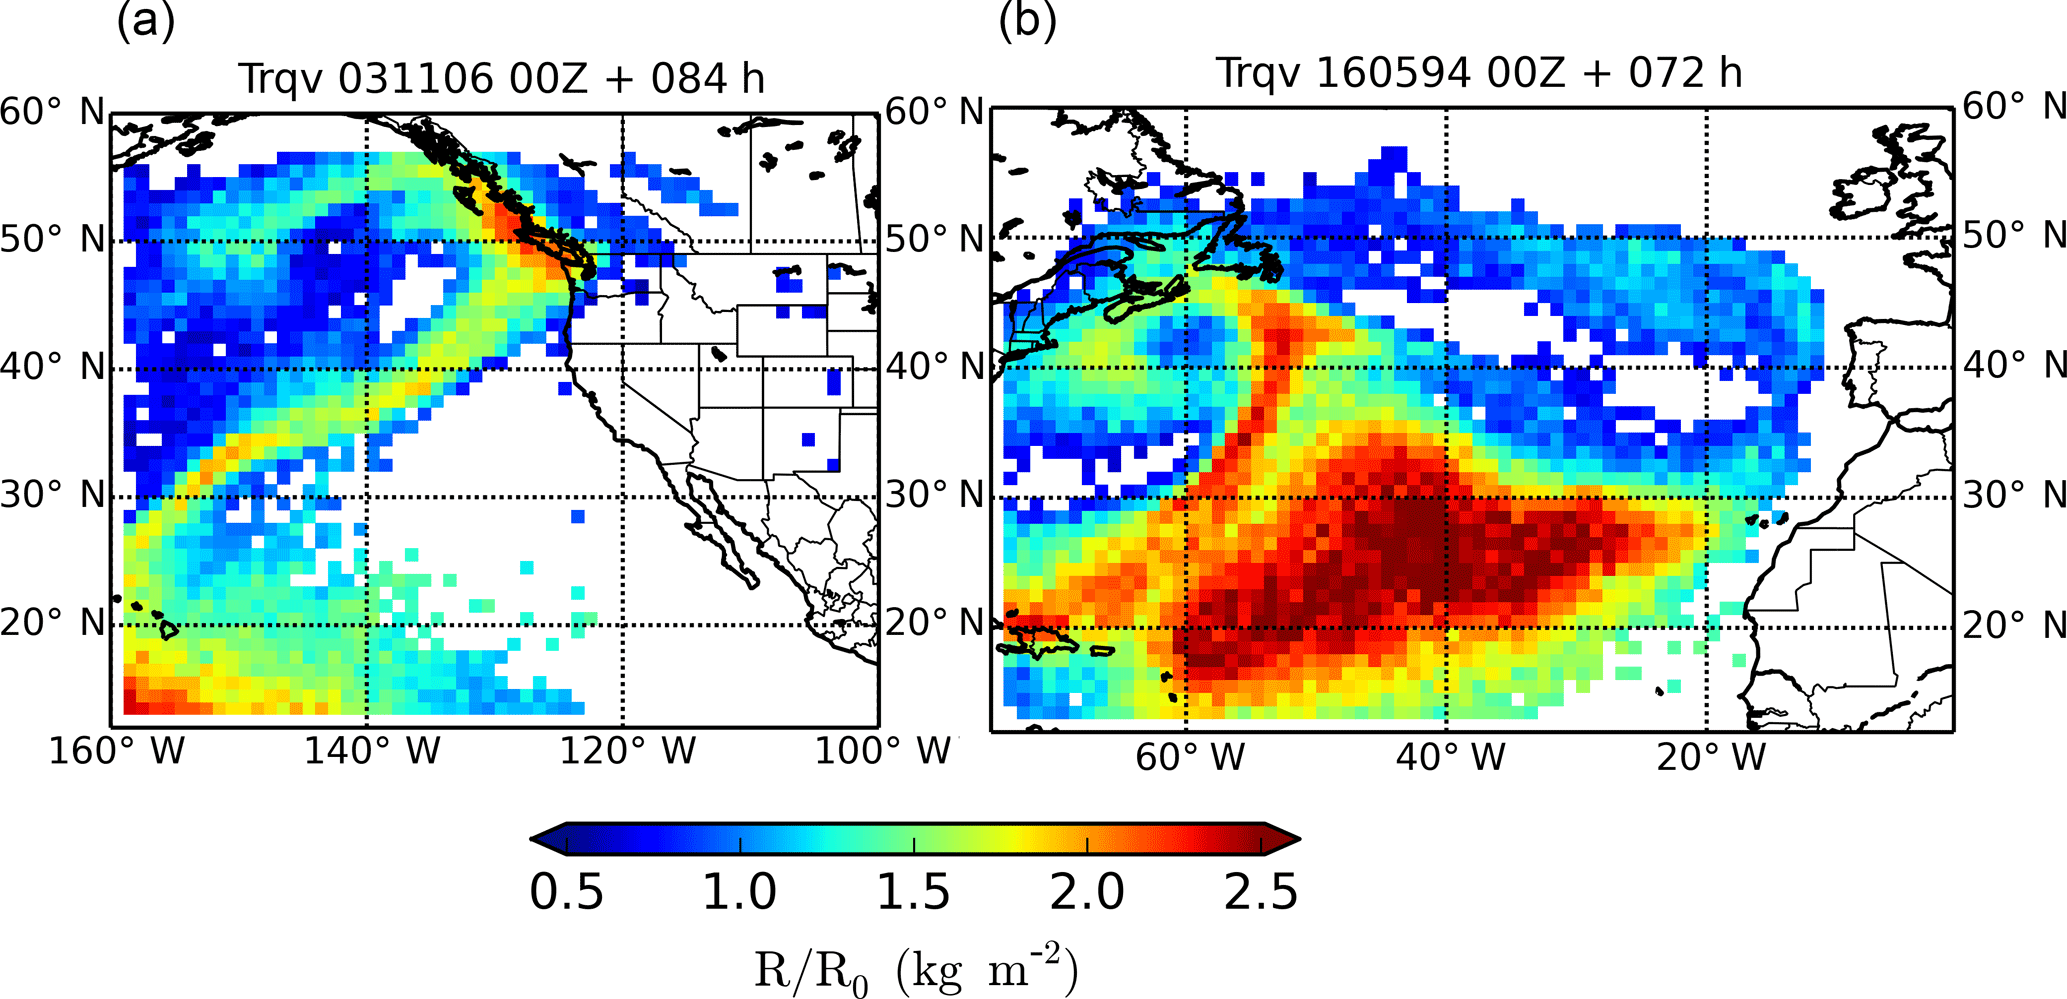
Figure 11Vertically integrated R∕R0 for the Pacific (a) and Atlantic (b) cases. Titles indicate the number of hours that have passed since the beginning of the simulations.
Two Lagrangian and inertial models have been used to compare the trajectories of tagged moisture from the tropics to evaluate the intense atmospheric river that devastated Pacific Northwestern America with flooding rains and intense winds in early November 2006 and the AR that affected the western Iberian Peninsula during mid-May 1994. Lagrangian particles are distinguished from inertial or active tracers in that the first follow the streamlines, while the second are accelerated due to external forces acting on the particle; see Eq. (2). Both models reproduce the structure of the ARs, but inertial tracers keep the moisture content longer and farther than the pure Lagrangian ones. The major difference between the two models can be found in vertical motions. Thus, we suggest that pure Lagrangian particles suffer from an overestimation of the vertical displacement, leading to rapid moisture loss.
Our results suggest that for the landfalling AR, most of the moisture observed near the coast has a tropical or subtropical origin. Local convergence transport is responsible for the remaining moisture (Eiras-Barca et al., 2017). Comparing the inertial and Lagrangian models, the tagged inertial moisture concentrations over the Pacific coast are larger than for the Lagrangian ones and closer to the IWV analysis. For the Atlantic coast sites, the second branch of the river was correctly simulated by the inertial model, but not for the Lagrangian model.
The parameterization of Eq. (5) in terms of the vapor excess for the tagged tracers (Eq. 6) has proven to be consistent with observations. The ability of the inertial tracers to respond to both thermodynamics and dynamical atmospheric changes has proven to be an important issue to adequately describe the amount of water vapor content traveling long distances. The influence of a time-dependent radius is more important in the vicinity of the ARs as tracers move in the vertical direction. Although both Lagrangian and inertial models used the same wind field, convective, and condensation parameterizations, the tagged moisture content at the coast was always smaller for the former model. The Lagrangian model overestimates the vertical advection, leading to faster moisture loss.
Our results contribute to explaining the transport mechanism linked to ARs based on the important contribution of tropic moisture to atmospheric rivers. Tracking moisture using inertial or active tracers has been shown to model the moisture contribution to ARs much better than using a Lagrangian model. However, an in-depth investigation with a sufficient number of cases and further diagnostics would be needed to draw a more robust general conclusion.
Data sets are available upon request by contacting the correspondence author.
The supplement related to this article is available online at: https://doi.org/10.5194/esd-9-785-2018-supplement.
The authors declare that they have no conflict of interest.
ERA-Interim data were supported by the ECMWF. This work was financially supported
by Ministerio de Economía, Industria y Competitividad (CGL2017-89859-R
and CGL2013-45932-R), with contributions by the COST Action MP1305 and CRETUS
strategic partnership (AGRUP2015/02). All these programs are co-funded by
the ERDF (EU). The computational part of this work was done in the supercomputing
center of Galicia, CESGA.
Edited by: Ben Kravitz
Reviewed by: Ana María Durán-Quesada and one anonymous referee
Bao, J. W., Michelson, S. A., Neiman, P. J., Ralph, F. M., and Wilczak, J. M.: Interpretation of enhanced integrated water vapor bands associated with extratropical cyclones: Their formation and connection to tropical moisture, Mon. Weather Rev., 134, 1063–1080, 2006. a
Belo-Pereira, M., Dutra, E., and Viterbo, P.: Evaluation of global precipitation data sets over the Iberian Peninsula, J. Geophys. Res.-Atmos., 116, D20101, https://doi.org/10.1029/2010JD015481, 2011. a
Cordeira, J. M., Ralph, F. M., and Moore, B. J: The development and evolution of two atmospheric rivers in proximity to western North Pacific tropical cyclones in October 2010, Mon. Weather Rev., 141, 4234–4255, 2013. a
Dacre, H. F., Clark, P. A., Martinez-Alvarado, O., Stringer, M. A., and Lavers, D. A.: How do atmospheric rivers form?, B. Am. Meteorol. Soc., 96, 1243–1255, 2015. a
Daitche, A.: Advection of inertial particles in the presence of the history force: Higher order numerical schemes, J. Comp Phys., 254, 93–106, https://doi.org/10.1016/j.jcp.2013.07.024, 2013. a
Dee, D. P., Uppala, S. M., Simmons, A. J., Berrisford, P., Poli, P., Kobayashi, S., Andrae, U., Balmaseda, M. A., Balsamo, G., Bauer, P., Bechtold, P., Beljaars, A. C. M., van de Berg, L., Bidlot, J., Bormann, N., Delsol, C., Dragani, R., Fuentes, M., Geer, A. J., Haimberger, L., Healy, S. B., Hersbach, H., Holm, E. V., Isaksen, L., Kallberg, P., Koehler, M., Matricardi, M., McNally, A. P., Monge-Sanz, B. M., Morcrette, J. J., Park, B. K., Peubey, C., de Rosnay, P., Tavolato, C., Thepaut, J. N., and Vitart, F.: The ERA-Interim reanalysis: configuration and performance of the data assimilation system, Q. J. Roy. Meteorol. Soc., 137, 553–597, https://doi.org/10.1002/qj.828, 2011. a
Dettinger, M. D., Ralph, F. M., Das, T., Neiman, P. J., and Cayan, D. R.: Atmospheric rivers, floods and the water resources of California, Water, 3, 445–478, https://doi.org/10.3390/w3020445, 2011. a
Dettinger, M., Ralph, F. M., and Lavers, D.: Setting the stage for a global science of atmospheric rivers, Eos Trans. Am. Geophys. Union, 96, https://doi.org/10.1029/2015EO038675, 2015. a
Eiras-Barca, J., Brands, S., and Míguez-Macho, G.: Seasonal variations in North Atlantic atmospheric river activity and associations with anomalous precipitation over the Iberian Atlantic Margin, J. Geophys. Res.-Atmos., 21, 931–948, https://doi.org/10.1002/2015JD023379, 2016. a
Eiras-Barca, J., Dominguez, F., Hu, H., Garaboa-Paz, D., and Miguez-Macho, G.: Evaluation of the moisture sources in two extreme landfalling atmospheric river events using an Eulerian WRF tracers tool, Earth Syst. Dynam., 8, 1247–1261, https://doi.org/10.5194/esd-8-1247-2017, 2017. a, b, c, d
Eiras-Barca, J., Ramos, A. M., Pinto, J. G., Trigo, R. M., Liberato, M. L. R., and Miguez-Macho, G.: The concurrence of atmospheric rivers and explosive cyclogenesis in the North Atlantic and North Pacific basins, Earth Syst. Dynam., 9, 91–102, https://doi.org/10.5194/esd-9-91-2018, 2018. a
Emanuel, K. A. and Zivkovic-Rothman, M.: Development and evaluation of a convection scheme for use in climate models, J. Atmos. Sci., 56, 1766–1782, https://doi.org/10.1175/1520-0469(1999)056<1766:DAEOAC>2.0.CO;2, 1999. a
Garaboa-Paz, D., Eiras-Barca, J., Huhn, F., and Pérez-Muñuzuri, V.: Lagrangian coherent structures along atmospheric rivers, Chaos, 25, 063105, https://doi.org/10.1063/1.4919768, 2015. a
Garaboa-Paz, D., Eiras-Barca, J., and Pérez-Muñuzuri, V.: Climatology of Lyapunov exponents: the link between atmospheric rivers and large-scale mixing variability, Earth Syst. Dynam., 8, 865–873, https://doi.org/10.5194/esd-8-865-2017, 2017. a
Gimeno, L., Drumond, A., Nieto, R., Trigo, R. M., and Stohl, A.: On the origin of continental precipitation, Geophys. Res. Lett., 37, 1–7, https://doi.org/10.1029/2010GL043712, 2010. a
Gimeno, L., Stohl, A., Trigo, R. M., Dominguez, F., Yoshimura, K., Yu, L., Drumond, A., Durn-Quesada, A. M., and Nieto, R.: Oceanic and terrestrial sources of continental precipitation, Rev. Geophys., 50, 1–41, https://doi.org/10.1029/2012RG000389, 2012. a
Gimeno, L., Dominguez, F., Nieto, R., Trigo, R., Drumond, A., Reason, C. J. C., Taschetto, A., Ramos, A. M., Kumar, R., and Marengo, J.: Major Mechanisms of Atmospheric Moisture Transport and Their Role in Extreme Precipitation Events, Ann. Rev. Environ. Resour., 41, 117–141, https://doi.org/10.1146/annurev-environ-110615-085558, 2016. a
Herrera, S., Gutiérrez, J. M., Ancell, R., Pons, M. R., Frías, M. D., and Fernández, J.: Development and analysis of a 50-year high-resolution daily gridded precipitation dataset over Spain (Spain02), Int. J. Climatol., 32, 74–85, https://doi.org/10.1002/joc.2256, 2012. a
Insua-Costa, D. and Miguez-Macho, G.: A new moisture tagging capability in the Weather Research and Forecasting model: formulation, validation and application to the 2014 Great Lake-effect snowstorm, Earth Syst. Dynam., 9, 167–185, https://doi.org/10.5194/esd-9-167-2018, 2018. a
Lavers, D. A. and Villarini, G.: The nexus between atmospheric rivers and extreme precipitation across Europe, Geophys. Res. Lett., 40, 3259–3264, https://doi.org/10.1002/grl.50636, 2013. a, b
Livneh, B., Bohn, T. J., Pierce, D. W., Munoz-Arriola, F., Nijssen, B., Vose, R., Cayan, D. R., and Brekke, L.: A spatially comprehensive, hydrometeorological data set for Mexico, the US, and Southern Canada 1950–2013, Scientific Data, 2, 150042, https://doi.org/10.1038/sdata.2015.42, 2015. a
Magnaudet, J. and Legendre, D.: The viscous drag force on a spherical bubble with a time-dependent radius, Phys. Fluids, 10, 550–554, https://doi.org/10.1063/1.869582, 1998. a
Maxey, M. R. and Riley, J. J.: Equation of motion for a small rigid sphere in a nonuniform flow, Phys. Fluids, 26, 883–889, https://doi.org/10.1063/1.864230, 1983. a
Michaelides, E. E.: Hydrodynamic force and heat/mass transfer from particles, bubbles, and drops, J. Fluids Eng., 125, 209–238, https://doi.org/10.1115/1.1537258, 2003. a, b
Neiman, P. J., Ralph, F. M., Wick, G. A., Kuo, Y., Wee, T., Ma, Z., Taylor, G. H., and Dettinger, M. D.: Diagnosis of an Intense Atmospheric River Impacting the Pacific Northwest: Storm Summary and Offshore Vertical Structure Observed with COSMIC Satellite Retrievals, Mon. Weather Rev., 136, 4398–4420, https://doi.org/10.1175/2008MWR2550.1, 2008. a
Newell, R. E., Newell, N. E., Zhu, Y., and Scott, C.: Tropospheric rivers? A pilot study, Geophys. Res. Lett., 19, 2401–2404, https://doi.org/10.1029/92GL02916, 1992. a
Pérez-Muñuzuri, V.: Clustering of inertial particles in compressible flows, Phys. Rev. E, 91, 052906, https://doi.org/10.1103/PhysRevE.91.052906, 2015. a
Pérez-Muñuzuri, V. and Garaboa-Paz, D.: Mixing of spherical bubbles with time-dependent radius in incompressible flows, Phys. Rev. E, 93, 023107, https://doi.org/10.1103/PhysRevE.93.023107, 2016. a
Plesset, M. S. and Prosperetti, A.: Bubble dynamics and cavitation, Ann. Rev. Fluid Mech., 9, 145–185, https://doi.org/10.1146/annurev.fl.09.010177.001045, 1977. a
Prosperetti, A.: The equation of bubble dynamics in a compressible liquid, Phys. Fluids, 30, 3626–3628, https://doi.org/10.1063/1.866445, 1987. a
Ralph, F. M. and Dettinger, M. D.: Storms, floods, and the science of atmospheric rivers, Eos Trans. Am. Geophys. Union, 92, 265–266, 2011. a
Ralph, F. M., Neiman, P. J., Kingsmill, D. E., Persson, P. O. G., White, A. B., Strem, E. T., Andrews, E. D., Antweiler, R. C., and Wick, G. A.: Satellite and CALJET aircraft observations of atmospheric rivers over the eastern North Pacific Ocean during the winter of 1997/98, Mon. Weather Rev., 132, 1721–1745, 2004. a
Ramos, A. M., Nieto, R., Tomé, R., Gimeno, L., Trigo, R. M., Liberato, M. L., and Lavers, D. A.: Atmospheric rivers moisture sources from a Lagrangian perspective, Earth Syst. Dynam., 7, 371–384, https://doi.org/10.5194/esd-7-371-2016, 2016. a, b
Singh, H. A., Bitz, C. M., Nusbaumer, J., and Noone, D. C.: A mathematical framework for analysis of water tracers: Part 1: Development of theory and application to the preindustrial mean state, J. Adv. Model. Earth Syst., 8, 991–1013, 2016. a
Stohl, A. and James, P.: A Lagrangian analysis of the atmospheric branch of the global water cycle. Part I: Method description, validation, and demonstration for the August 2002 flooding in Central Europe, J. Hydrometeorol., 5, 656–678, https://doi.org/10.1175/1525-7541(2004)005<0656:ALAOTA>2.0.CO;2, 2004. a
Stohl, A. and James, P.: Lagrangian analysis of the atmospheric branch of the global water cycle. Part II: Moisture transports between Earths ocean basins and river catchments, J. Hydrometeorol., 6, 961–984, https://doi.org/10.1175/JHM470.1, 2005. a
Stohl, A., Forster, C., Frank, A., Seibert, P., and Wotawa, G.: Technical Note: The Lagrangian particle dispersion model FLEXPART version 6.2, Atmos. Chem. Phys. 5, 2461–2474, https://doi.org/10.5194/acp-5-2461-2005, 2005. a, b
Takemura, F. and Magnaudet, J.: The history force on a rapidly shrinking bubble rising at finite Reynolds number, Phys. Fluids, 16, 3247–3255, https://doi.org/10.1063/1.1760691, 2004. a, b
Waliser, D. and Guan, B.: Extreme winds and precipitation during landfall of atmospheric rivers, Nat. Geosci. 10, 179–183, https://doi.org/10.1038/ngeo2894, 2017. a
Zapryanov, Z. and Tabakova, S.: Dynamics of bubbles, drops and rigid particles, Science + Business Media, Dordrecht, 1999. a
Zhu, Y. and Newell, R.: A proposed algorithm for moisture fluxes from atmospheric rivers, Mon. Weather Rev., 126, 725–735, https://doi.org/10.1175/1520-0493(1998)126<0725:APAFMF>2.0.CO;2, 1998. a, b