the Creative Commons Attribution 4.0 License.
the Creative Commons Attribution 4.0 License.
 | 28 Mar 2018
A bias-corrected CMIP5 dataset for Africa using the CDF-t method – a contribution to agricultural impact studies
Adjoua Moise Famien
Serge Janicot
Abe Delfin Ochou
Mathieu Vrac
Dimitri Defrance
Benjamin Sultan
Thomas Noël
The objective of this paper is to present a new dataset of bias-corrected CMIP5 global climate model (GCM) daily data over Africa. This dataset was obtained using the cumulative distribution function transform (CDF-t) method, a method that has been applied to several regions and contexts but never to Africa. Here CDF-t has been applied over the period 1950–2099 combining Historical runs and climate change scenarios for six variables: precipitation, mean near-surface air temperature, near-surface maximum air temperature, near-surface minimum air temperature, surface downwelling shortwave radiation, and wind speed, which are critical variables for agricultural purposes. WFDEI has been used as the reference dataset to correct the GCMs. Evaluation of the results over West Africa has been carried out on a list of priority user-based metrics that were discussed and selected with stakeholders. It includes simulated yield using a crop model simulating maize growth. These bias-corrected GCM data have been compared with another available dataset of bias-corrected GCMs using WATCH Forcing Data as the reference dataset. The impact of WFD, WFDEI, and also EWEMBI reference datasets has been also examined in detail. It is shown that CDF-t is very effective at removing the biases and reducing the high inter-GCM scattering. Differences with other bias-corrected GCM data are mainly due to the differences among the reference datasets. This is particularly true for surface downwelling shortwave radiation, which has a significant impact in terms of simulated maize yields. Projections of future yields over West Africa are quite different, depending on the bias-correction method used. However all these projections show a similar relative decreasing trend over the 21st century.
- Article
(13596 KB) -
Supplement
(3064 KB) - BibTeX
- EndNote


Global and regional climate models (GCMs and RCMs) are used to produce projections of future climates driven by various types of greenhouse gas emission scenarios. The last Coupled Model Intercomparison Project (Meehl et al., 2000), CMIP5, provides simulations for the preindustrial period (CO2 concentration at a level of 280 ppm), historical period (1860–2005; including real evolutions of CO2 and other greenhouse gas concentrations, anthropogenic and volcanic eruption aerosol contents, solar activity), and future climate projections based on different CO2 emission trajectory scenarios, Representative Concentration Pathways RCPx.x (Moss et al., 2010; x.x corresponding to the radiative forcing in W m−2 in 2100), RCP2.6, RCP4.5, RCP6.0, and RCP8.5 (Taylor et al., 2012).
Scientific communities working on evaluation and modelling of climate change impacts (in terms of crop yields, water resources, health, etc.) are increasingly using these simulation outputs either to compute related impact metrics or to run impact models. However robust biases are still present in climate models due to ill-defined processes and associated parametrizations, leading to biased statistical distributions of simulated physical and dynamical variables (Vrac and Friederichs, 2015). Then statistical bias corrections must be applied to variables used in impact model simulations (Vrac et al., 2016). For instance, warmer-than-normal sea surface temperatures in the equatorial Atlantic lead to a too southern location of the Inter-Tropical Convergence Zone (ITCZ) in boreal summer over West Africa. This bias has not been reduced between CMIP3 and CMIP5 GCM simulations (Roehrig et al., 2013). This too southern ITCZ location over West Africa leads to too weak precipitation over the Sahel and too weak crop yields whose values cannot be used as relevant information for stakeholders and farmers.
GCM and RCM output data have to be adjusted to statistical distributions of observation-based reference data. However, the use of different bias-correction methods in combination with different reference datasets contributes to the total uncertainty in climate projections and can contribute in some contexts more than the use of different GCMs or RCMs (Iizumi et al., 2017). Thus using multiple bias-correction techniques and reference datasets can be recommended. For instance, a bias correction of a subset of five GCMs of the CMIP5 database was realized at a global scale through the ISIMIP project (Hempel et al., 2013a), the first Inter-Sectorial Impact Model Intercomparison Project1. These corrections were applied at a daily scale from 1 January 1950 to 31 December 2099 to historical and all RCP scenarios for five GCMs at a 0.5∘ × 0.5∘ grid using WATCH Forcing Data (WFD) data as observation-based reference. More recently a ISIMIP2b bias correction using an improved reference dataset, EWEMBI, has been realized for three out of the five CMIP5 GCMs' data, and the results have been compared to the bias-corrected ISIMIP/WFD data (Lange, 2017a). Significant differences have been highlighted that are closely related to differences between WDF and EWEMBI data.
The objectives of this paper are to present and evaluate bias-corrected GCM data obtained by performing the cumulative distribution function transform (CDF-t) method over Africa to quantify the sensitivity of the bias-corrected data to different reference datasets and to illustrate this in terms of simulated crop yields. It is a contribution to the AMMA-20502 project, centred on West Africa, the goals of which are to significantly improve scientific understanding of climate variability and change across Africa and the impact of climate change on specific development decisions, to introduce flexible methods for integrating improved climate information and tools in specific decision-making contexts, and to improve medium to long-term (5–40 years) decision-making, policies, planning, and investment by African stakeholders and donors.
Bias correction has been applied to daily data of six variables critical for these types of impact: precipitation (pr), mean near-surface air temperature (tas), near-surface maximum air temperature (tasmax), near-surface minimum air temperature (tasmin), surface downwelling shortwave radiation (rsds), and wind speed (wind). The bias correction has been performed using the CDF-t method (Michelangeli et al., 2009), a method that has been widely used and validated for various variables and in various contexts (Kallache et al., 2011; Lavaysse et al., 2012; Vautard et al., 2013; Vrac and Friederichs, 2015; Vrac et al., 2012, 2016), including tropical areas (Oettli et al., 2011; Vigaud et al., 2013), but not Africa. These corrections have been applied to 29 GCMs over the 1950–2005 period and RCP2.6, RCP4.5, and RCP8.5 2006–2099 projections. The observation-based reference dataset used for bias corrections is WFDEI, the WATCH Forcing Data (Weedon et al., 2011) methodology applied to ERA-Interim data, for the period from 1 January 1979 to 31 December 2013 on a 0.5∘ × 0.5∘ grid (Weedon et al., 2014).
Section 2 presents the reference data. A first intercomparison of WFD, WFDEI, and EWEMBI is presented in terms of mean seasonal fields over West Africa. In Sect. 3 the CDF-t bias-correction method is shortly presented. Then tests are carried out over 1979–2013 to evaluate the sensitivity of the corrections to the calibration period. In Sect. 4, the evaluation of the CDF-t bias correction is detailed over West Africa, first on mean seasonal fields, then on daily metrics. CDF-t bias-corrected GCM data are also compared with ISIMIP/WFD bias-corrected data for the five GCMs used in ISIMIP. The significant impact induced by some improvements introduced in WFDEI data will be shown. CDF-t outputs are also compared to products from EWEMBI. To go further into this evaluation, a crop model has been used to test the impact on simulated crop yields (specifically a local maize cultivar) of bias-correction data with one GCM and of the three reference data. A sensitivity analysis to individual forcing variables (temperature, pr, and rsds) is also presented. Finally the bias-correction impact on crop simulations in the context of RCP8.5 climate change projections is shown. Conclusions are given in Sect. 5.
The AMMA-2050 dataset comprises bias-corrected daily data for the variables pr, tas, maximum air temperature and minimum air temperature, rsds, and wind speed. It covers the domain 20∘ W–55∘ E/40∘ S–40∘ N, including all of Africa. In this paper, results are presented for West Africa (20∘ W–20∘ E/0–25∘ N) in boreal summer as it is the focus of AMMA-2050.
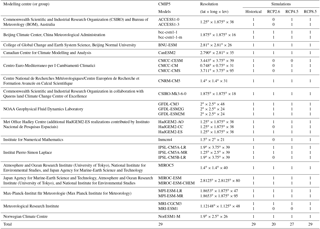
Table 1List of available CMIP5 models used for historical and RCP simulations. The five GCMs also used in ISIMIP are in italics. The number in each column is the number of ensemble member used in this work. Zero indicates that no run was used. The last line shows the total number of runs used for each simulation.
2.1 Simulations
We use daily data extracted from the CMIP5 archive, covering the period from 1 January 1950 to 31 December 2099. Based on availability of daily data, it comprises 29 GCMs for the 1950–2005 historical period and RCP8.5 2006–2099 projection, 27 GCMs for the RCP4.5 projection, and 20 GCMs for the RCP2.6 projection (see Table 1 for more details). Only one run has been used for each GCM. For an easier comparison with observation, these “raw” data have been interpolated on the 0.5∘ × 0.5∘ grid of WFDEI using a bilinear approach for temperatures and wind and using a “nearest neighbour” approach for precipitation. Then, bias-corrected data are available on the 0.5∘ × 0.5∘ grid.
2.2 Reference observation datasets
The observation-based reference dataset is critical for the correction of GCM biases, especially when corrections are applied to daily data. The reference dataset must also have a global coverage on a regular grid, which may induce large uncertainties in void in situ data areas as in Africa. So we used the available WFD, WFDEI, and EWEMBI reference datasets to compare to each other and to compare bias-corrected (with WFD) ISIMIP data with bias-corrected (with WFDEI) AMMA-2050 data.
The WFD dataset (Weedon et al., 2011) is a combination of ERA-40 daily reanalysis of the European Centre for Medium-Range Weather Forecasts (ECMWF) at a grid resolution of 2.5∘ and the Climate Research Unit (CRU) TS2.1 dataset that provides observed time series of monthly variations in the climate on a resolution grid of 0.5∘. A correction for monthly mean rainfall is included using the Global Precipitation Climatology Centre (GPCC) version 4 dataset (Hagemann et al., 2011). The WFD data are available over the period 1958–2001 on a 0.5∘ grid over land area points. The WFD dataset has been used over 1979–2001.
WFDEI, an improved version of WFD, has been produced based on ERA-Interim reanalysis, over the period from 1 January 1979 to 31 December 2013 on a 0.5∘ × 0.5∘ grid (Weedon et al., 2014). Improvements come from the 4D-var data assimilation system with 6 h windows in ERA-Interim instead of 3D-var in ERA-40. Compared to ERA-40, ERA-Interim uses a more extensive suite of satellites, atmospheric soundings, and surface observations and provides substantial improvement in surface meteorological variables (Dee et al., 2011), in particular with a new aerosol loading distributions and corrections for downward shortwave fluxes (leading in particular to larger average WFDEI values over the Sahara and northern Africa), leading to less bias compared to globally distributed observations. ERA-Interim also has a reduced Gaussian grid spectral model resolution of T255 instead of T159 for ERA-40, leading to data much closer to the regular 0.5∘ × 0.5∘ spatial resolution and to the elevation distribution used for WFDEI. A correction for monthly mean rainfall is included using the GPCCv5/v6 dataset. The WFDEI dataset has been used over 1979–2013.
More recently, the EWEMBI dataset has been produced within ISIMIP (Lange, 2016, 2017b). Over land, EWEMBI is identical to the WFDEI dataset for pr, daily mean, minimum, and maximum near-surface air temperature, and 10 m wind speed but different for surface downwelling shortwave radiation. Data sources of EWEMBI are ERA-Interim data, WFDEI, eartH2Observe forcing data (Dutra, 2015), and NASA/GEWEX Surface Radiation Budget data (Stackhouse Jr. et al., 2011) primary-algorithm estimates of daily mean rsds from SRB release 3.0 (Frieler et al., 2017; Lange, 2017b). Significant differences have been highlighted between WFD-based and EWEMBI-based bias-corrected data that are closely related to similar improvements from WDF to EWEMBI data. The EWEMBI dataset has been used over 1979–2013.
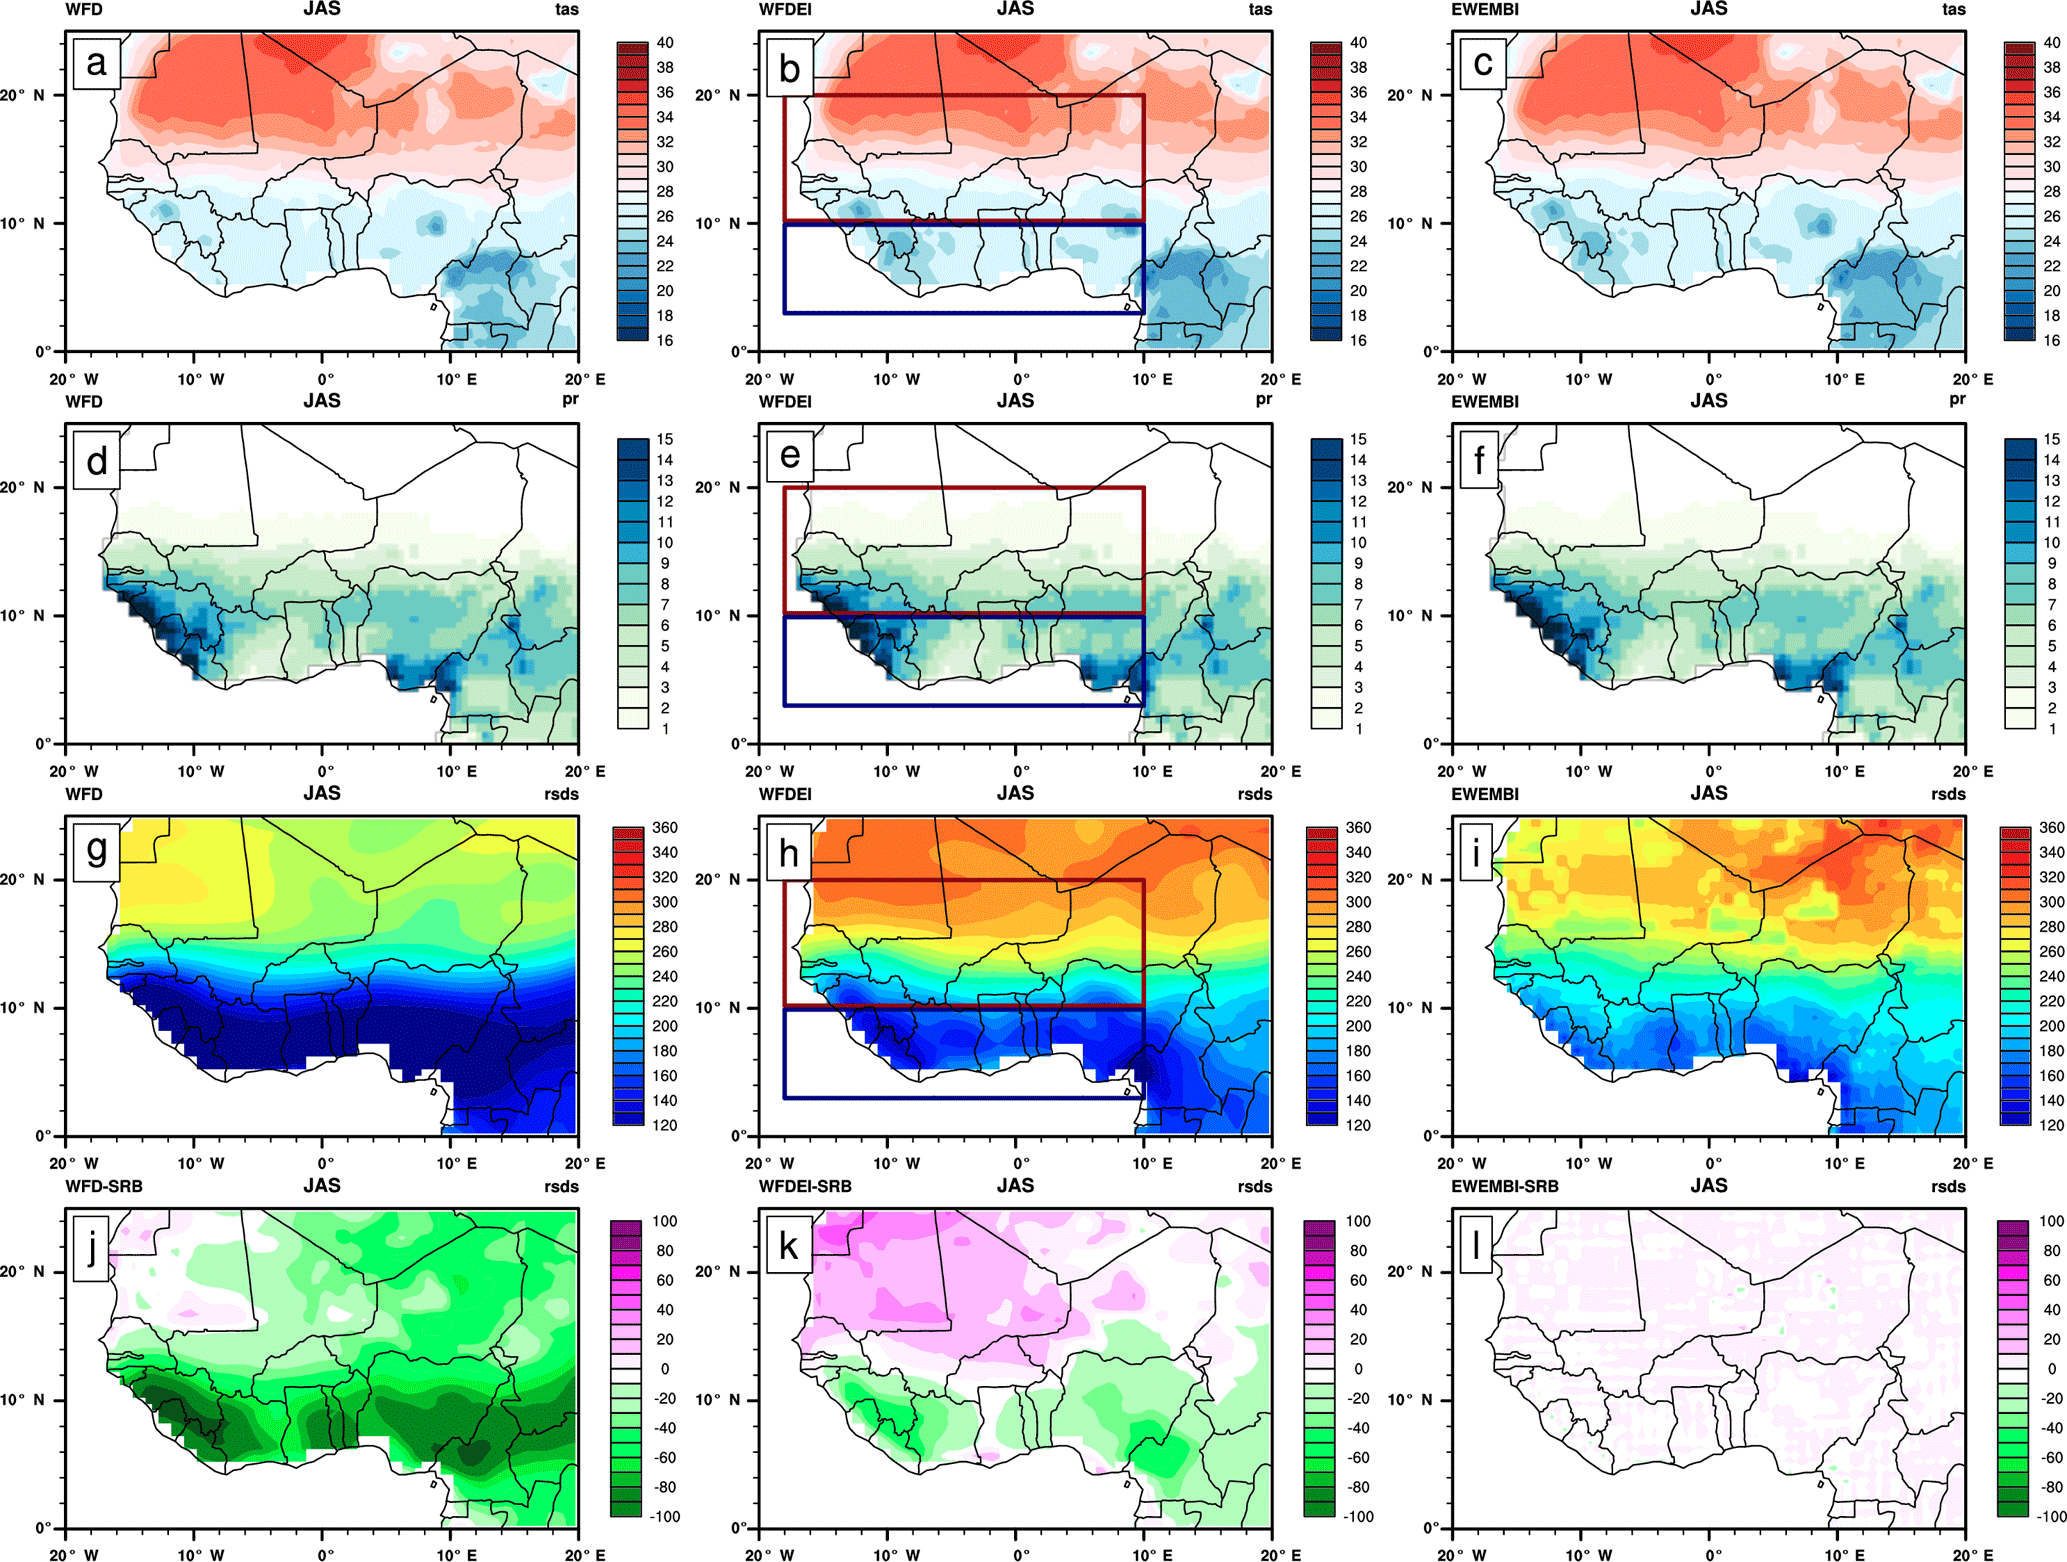
Figure 1Summer climatology from different observation datasets (WFD, WFDEI, and EWEMBI): (a–c) for near-surface temperature (∘C) over 1979–2001, (d–f) for precipitation rate (mm day−1) over the 1979–2001 period, (g–i) for solar radiation (W m−2) over the 1984–2001 period, and the difference among WFD (j) over 1984–2007, WFDEI (k) over 1984–2007, EWEMBI (l) over 1984–2001, and SRB solar radiation. The red box (18∘ W–10∘ E; 10–20∘ N) and blue box (18∘ W–10∘ E; 3–10∘ N) respectively represent the Sahel and Guinea regions used in this study.
2.3 Intercomparison of WFD, WFDEI, and EWEMBI on mean seasonal fields over West Africa
In the following, to reduce the number of figures, the results are presented only for the summer season, July–September (JAS), which is the main rainy season over the Sahel. Similar computations have been performed over the other seasons, especially over spring, which is the main rainy season over the Guinean coast, and some of the results will be commented on.
Figure 1 presents the July–September mean seasonal fields of WFD, WFDEI, and EWEMBI for tas, pr, and rsds. Regarding tas, the mean fields of the three reference datasets are very close, showing the set-up in northern spring and summer of the high-temperature area associated with the Saharan and Saudi Arabia heat lows. Regarding pr, the seasonal fields are also very close, showing the seasonal migration of the ITCZ between spring and summer. Local maxima associated with highlands like the Fouta Djalloon or Cameroon mountains are also clearly highlighted. Regarding rsds, more differences are evident between the three reference datasets. The mean seasonal fields show similar patterns with low values within the ITCZ area due to the high cloud coverage and high values over the Sahara due to low moisture and cloud coverage, but the range of values are quite different. Over the ITCZ, WFD rsds values are the weakest and EWEMBI values the highest. Over the Sahara WFD values are also the weakest but WFDEI values are a bit higher than for EWEMBI. In the remaining panels, differences are produced in respect to SRB data. Compared to SRB, EWEMBI data are very similar, which is logical since SRB data were used to correct ERA-Interim. WFDEI has moderate negative biases in the ITCZ area and weak positive biases over the Sahara, while WFD has high negative biases over the whole area.
3.1 The CDF-t method
In this work, we use the CDF-t method developed by Michelangeli et al. (2009) to adjust climate models. It consists in matching the CDF of a climate variable simulated by a model (here the GCM) to the CDF of this variable in observations (here WFDEI) through a mathematical function. CDF-t is a variant of the non-parametric quantile–quantile (QQ) method (Déqué, 2007). But contrary to the QQ method that projects the GCM CDF of simulated future data onto the CDF of historical data, CDF-t considers the CDF change between historical and future GCM simulations. Let FGh and FSh define the CDFs of a variable from the GCM (subscript G) and from a given reference location (subscript S) over a historical calibration period (subscript h). The transformation T allows going from FGh to FSh:
Replacing x with , where u is any probability in [0, 1]:
which provides a definition of T. Assuming T is stationary in time, the transformation can be applied to FGf, the CDF of the variable over a future or validation period f, to generate FSf, the CDF at the reference location for the same period f:
That is
Once FSf has been determined from Eq. (4), a QQ approach is carried out between FGf and FSf to generate local time series. While in Déqué (2007), QQ is applied directly between FGh and FSh, the CDF-t method generates quantile values through a QQ performed between FGf (and not FGh) and FSf (and not FSh). Values are then generated according to FSf in chronological agreement with future climate simulations. More details on the CDF-t method can be found in Vrac et al. (2012, 2016).
3.2 Application
This CDF-t approach has been applied to five out of the six variables (tas, tasmax, tasmin, rsds, and wind) over the period 1950–2099 (historical and RCP2.6, RCP4.5, and RCP8.5 runs). For pr, an updated CDF-t approach has been used, referred to as “singularity stochastic removal” (SSR), addressing rainfall occurrence and intensity issues (Vrac et al., 2016).
CDF-t has been applied month by month to take into account the strong seasonality over Africa. It has been applied using a moving window to smooth discontinuities (Vrac et al., 2016): a moving 17-year window is used as the “target” CDF, and the GCM data of the central 9 years are corrected. This process is repeated by moving the window forward by 9 years, covering the whole period of 1950-2099. Moreover, CDF-t preserves any long-term trend in the GCM data but neither trends in moments nor in quantiles (Vrac et al., 2012). GCM data have been interpolated to the WFDEI grid before being bias corrected, using a bilinear method for tas, tasmax, tasmin, rsds, and wind and a nearest neighbour method for pr.
Examples of CDF-t bias correction applied to mean West Africa daily pr data for the five GCMs used in ISIMIP are shown (Fig. S1 in the Supplement). It is represented in terms of cumulative distribution function. The distributions of raw GCM data are clearly different from the WFDEI data. Some of them show more low pr values in GCMs than in WFDEI while others have more low pr values. The CDF-t bias correction appears very effective as the WFDEI and bias-corrected GCM data distributions are closely superimposed.
3.3 Sensitivity of the correction to the calibration period over West Africa
Before applying the CDF-t correction through the moving window process over 1950–2099, the bias-correction method has to be calibrated individually for every GCM over a reference period. In order to have a calibration dataset as representative as possible of the variability in the various variables, especially pr, the time period 1979–2013 has finally been used for calibration of the bias-correction method. However the sensitivity to the calibration period has been explored over West Africa by testing it on two sub-periods, 1979–1996 and 1996–2013, to prevent any overestimation of the bias-correction performance. This has been performed on the five GCMs used in ISIMIP, and it is more specifically shown in the IPSL-CM5A-LR model in summer for tas, pr, and rsds (Supplement).
Three calibration periods have been tested: 1979–1996, 1996–2013, and 1979–2013 (see Fig. S2). First, it is clear that the bias correction is powerful to remove the cold bias of the raw data. Second, the positive trend present in the raw data over the period 1979–2013, as in WFDEI but with a weaker range, is preserved after the bias correction. This is probably due to the dry bias of pr over the Sahel in raw data that induces a higher sensitivity to the impact of anthropogenic global warming over the period than in observations. Third, the effect of the calibration period is clear. By using the calibration period 1979–1996, the remaining bias of corrected data is near zero and is weakly positive over 1997–2013, while by using the calibration period 1996–2013, the remaining bias of corrected data is near zero and is weakly negative over 1979–1995. Using the calibration period 1979–2013, the remaining bias is overall very weak and on average near zero. Similar tests have been carried out for the variables pr and rsds, and for the other seasons, with similar conclusions. Thus, while it can be thought that using the whole observational period to calibrate the bias-correction process may lead to overestimation of the fit between observations and bias-corrected data, it in fact provides a more robust correction. Therefore we choose the longest period 1979–2013 to perform the calibration process.
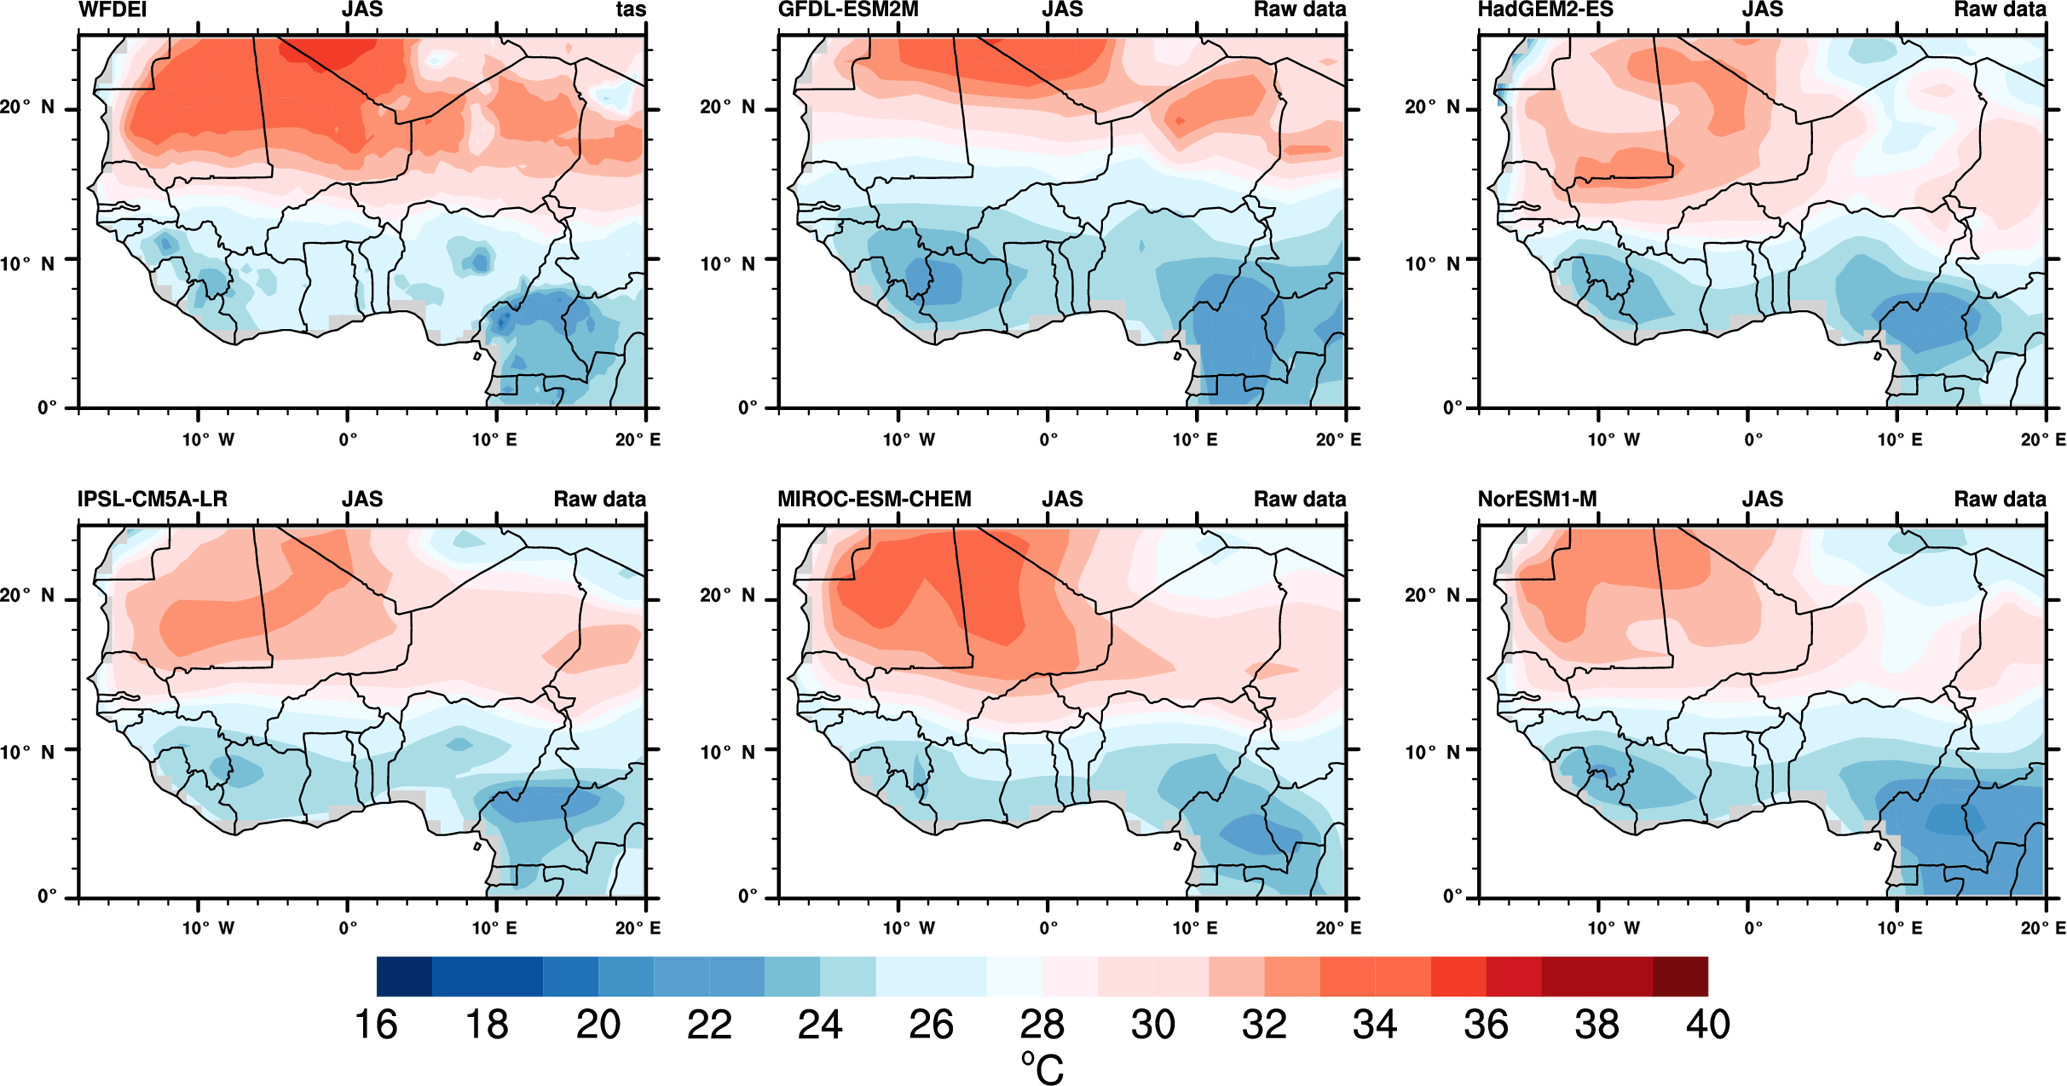
Figure 2Mean near-surface air temperature (∘C) in JAS 1979–2001 from WFDEI and from five CMIP5 GCMs' raw data (the GCMs also used in ISIMIP).
4.1 User-based metrics and diagnostics
A list of priority metrics has been established between scientists and stakeholders involved in AMMA-2050. We are presenting results based on some of these metrics related to the three variables, pr, near-surface air temperature (tas), and surface downwelling shortwave radiation (rsds). These metrics are
-
the seasonal mean for pr, tas, and rsds;
-
the mean time–latitude annual cycle over (15∘ W–15∘ E) for pr, tas, and rsds;
-
the 95th percentile of daily values for tas;
-
the number of days with tas > 30 ∘C;
-
the 95th percentile of daily values for pr;
-
the number of wet days (pr > 1 mm day−1);
-
the number of days with pr > 10 mm day−1;
-
the number of dry days (pr < 1 mm day−1);
-
the 95th percentile of the duration of consecutive dry days sequences.

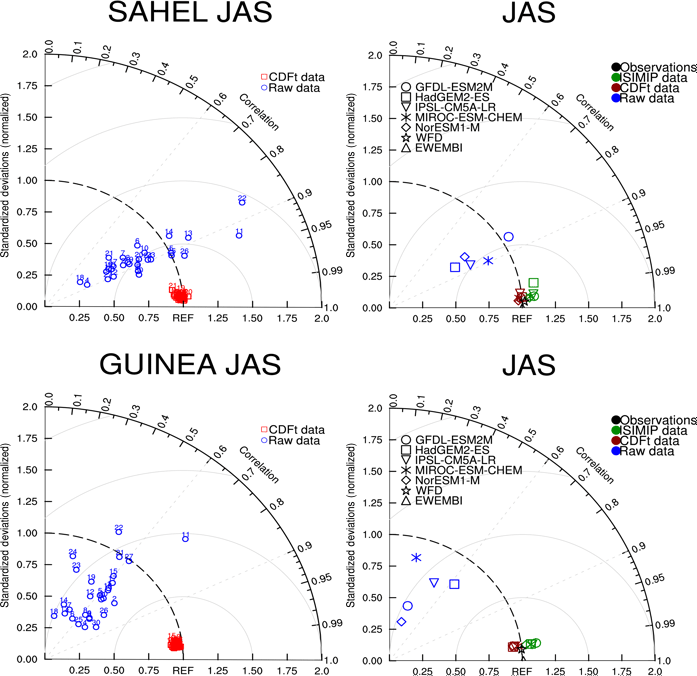
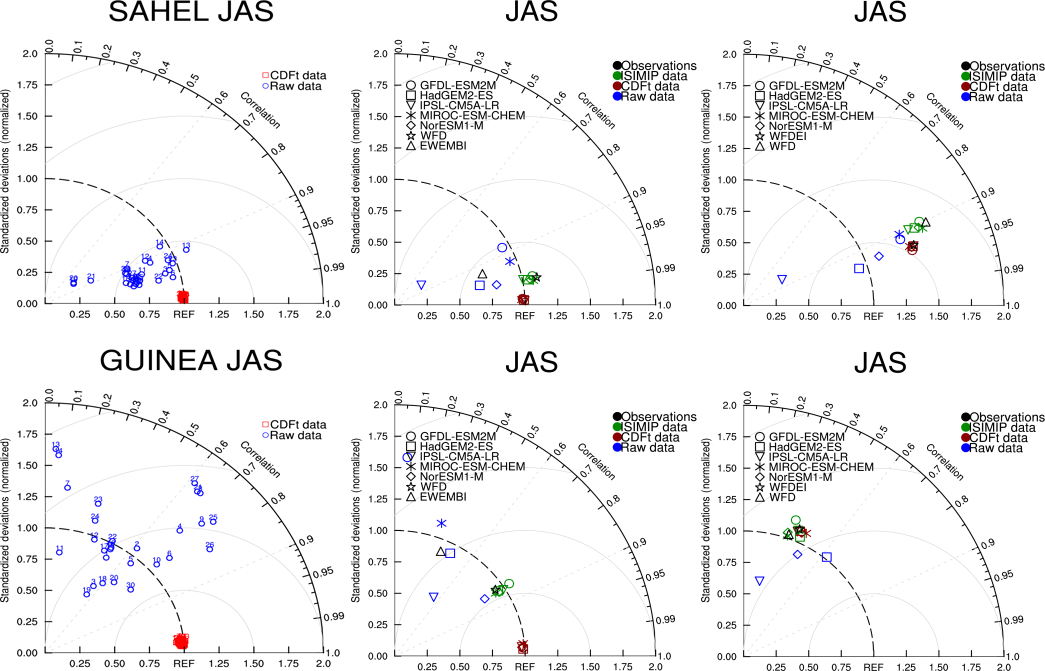
Figure 3Taylor diagrams relative to the mean of near-surface air temperature over 1979–2001 from 29 individual models (a) and five out of them (b) were also used in ISIMIP. Two areas are considered: Sahel and Guinea (see these boxes in Figs. 1, 18, or 19). Data are compared to WFDEI data. Taylor diagrams provide three statistics: the correlation coefficient between any tested field and the reference field (related to the azimuthal angle), the normalized standard deviation of the tested field in respect to the standard deviation of the reference field (proportional to the radial distance from the origin), and the centred root-mean-square difference between the tested field and the reference field (proportional to the distance from the REF point on the x axis; grey circles from 1 (with the lowest radius) to 4 (the highest radius)). “Observations” represents WFD and EWEMBI data (in black). Raw GCM data are in blue, CDF-t bias-corrected GCM data in red, and ISIMIP bias-corrected GCM data in green.
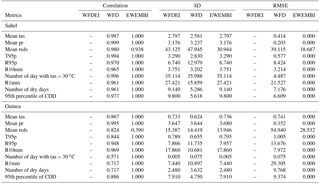
Table 2Spatial correlation, standard deviation (SD), and root-mean-square error (RMSE) computed for different observation datasets over the Sahel (18∘ W–10∘ E; 10–20∘ N) and Guinea (18∘ W–10∘ E; 3–10∘ N) areas in JAS. All scores are computed relative to WFDEI for seasonal mean precipitation (Mean pr), seasonal near-surface air temperature (Mean tas), seasonal surface downwelling shortwave radiation (Mean rsds), the 95th percentile of daily values for precipitation (R95p) and near-surface air temperature (T95p), the number of wet days (R1mm), the number of heavy days (R10mm), the number of dry days, the 95th percentile of consecutive dry days, and the number of days with tas greater than 30 ∘C. CDD: consecutive dry days.

4.2 Mean seasonal fields over West Africa
In the following, the Taylor diagram (Taylor, 2001) will be used to quantify the distance between the raw, bias-corrected GCM data and WFDEI data. This diagram provides three statistics, the spatial correlation coefficient between the tested field and the reference field, the normalized standard deviation of the tested field in respect to the standard deviation of the reference field, and the centred root-mean-square error (RMSE) between the tested field and the reference field. The Taylor diagram has also been used to evaluate the distance between the reference datasets WFD and EWEMBI relative to WFDEI. Table 2 sums up the three Taylor statistics of these reference datasets for all the metrics.
Regarding the seasonal mean metrics, WFDEI and EWEMBI statistics are similar except for rsds, for which they are quite different over the Guinean coast. WFD is also very close to WFDEI but all statistics are a bit different, with again more differences for the Guinea coast.
Figure 2 presents the mean JAS temperature fields over West Africa for WFDEI data and for raw data from the five GCMs used in ISIMIP. Figure S3 shows similar fields but for CDF-t bias-corrected data. Figure 3 shows the Taylor diagrams computed on JAS over the Sahel and Guinea areas for the 29 raw and bias-corrected GCM data compared to WFDEI data (first column) and the five GCMs used in ISIMIP in terms of raw data of CDF-t bias-corrected data and of ISIMIP bias-corrected data (second column). WFD and EWEMBI data are also plotted in these diagrams. In the Taylor diagrams the means of the fields are subtracted out before computing their second-order statistics, so these diagrams do not provide information about overall biases but characterize biases associated with centred pattern errors. Hence maps in Fig. 2 and Taylor diagrams in Fig. 3 provide complementary bias information.
Figure 2 shows that the raw GCMs capture the spatial structure of temperature over Africa rather well, characterized by high values over the Sahara in summer as well as in spring (not shown), and low values in northern fall and winter (not shown). However moderate cold biases exist over most of the area. Inter-model dispersion is also present. For instance, temperatures in MIROC-ESM-CHEM are about 2 ∘C higher than temperatures in HadGEM2-ES or IPSL-CM5A-LR. The bias-correction process improves quite well the simulations (see Fig. S3) and provides corrected mean seasonal fields very similar to WFDEI, even at small spatial scales as for lower temperatures over the Fouta Djalloon and Cameroon mountains. The Taylor diagrams (Fig. 3) quantify this improvement very clearly for the 29 GCMs. The raw GCMs (Fig. 3 left column) are quite scattered with spatial correlations, with WFDEI distributed between +0.1 and more than +0.9. For the Sahel area, correlations are quite high in JAS (centred around +0.9 between 0.5 and 0.98), while for the Guinean area correlations are globally centred around +0.4 (from 0.1 to 0.8). GCMs are also scattered in terms of normalized variances, from 0.6 to more than 2. The performance of the CDF-t bias correction is clearly high since all the GCMs are very close to the WFDEI reference point. Taylor diagrams enable comparison of the five GCMs used in ISIMIP in reference to WFDEI (Fig. 3 right column), for raw data and bias-corrected data using the CDF-t and ISIMIP methods. WFD and EWEMBI data are also plotted. CDF-t bias-corrected GCMs are very close to WFDEI. ISIMIP bias-corrected GCMs are centred around WFD and also near WFDEI (correlation higher than +0.9 and normalized standard deviation close to 1); however WFD is a bit more distant from WFDEI for the Guinean area (see also Table 2). EWEMBI data are even closer to WFDEI.
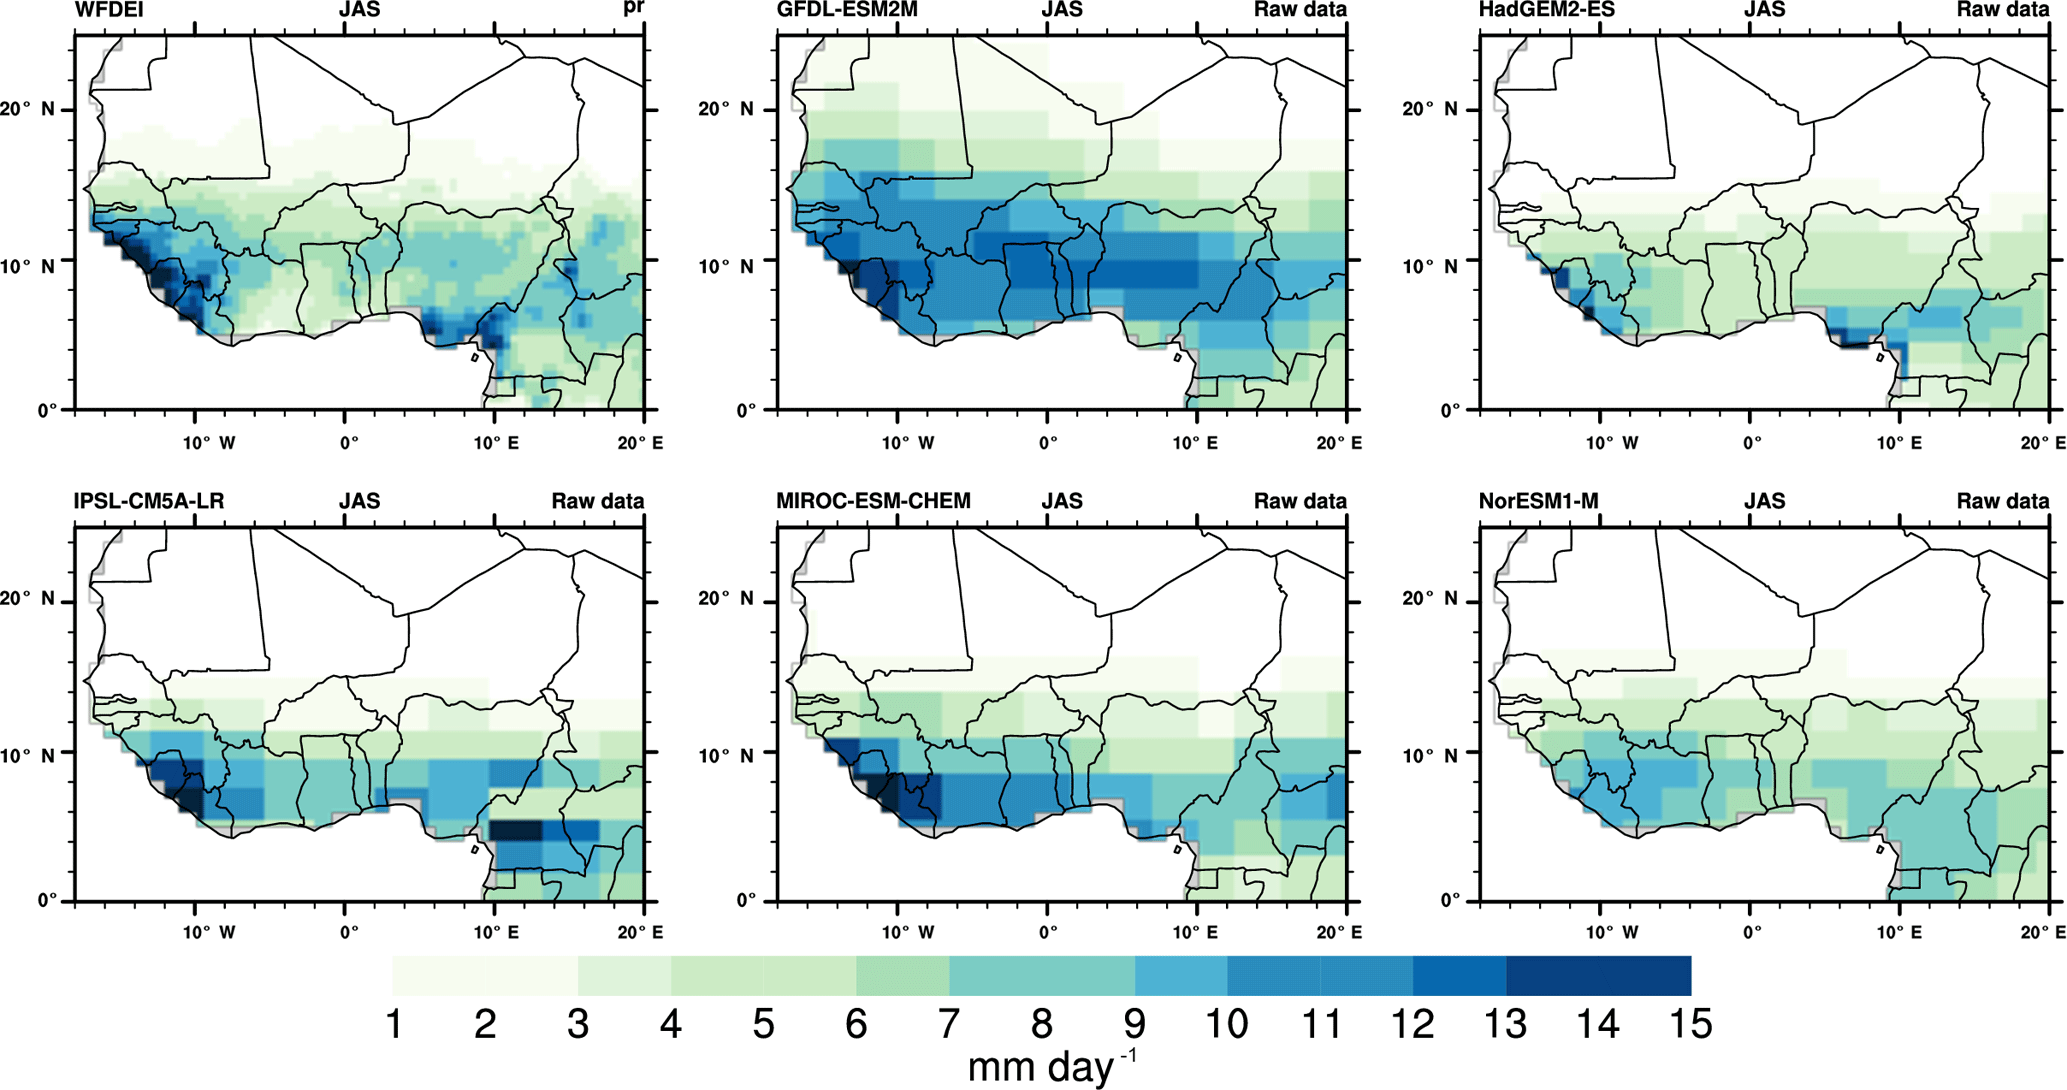
Figures 4, 5, and S4 show similar results but for pr. The seasonal fields of WFDEI show the mean location of the ITCZ in JAS (Fig. 4). Local maxima associated with highlands like the Fouta Djalloon or Cameroon mountains are also clearly highlighted. Raw GCMs reproduce this pattern but a lot of discrepancies can be noticed for all GCMs, in terms of pr amplitude, spatial pattern, and latitude extension. HadGEM2-ES has the weakest values while the four others produce pr amounts generally higher than WFDEI. The CDF-t bias correction very efficiently improves the GCM mean seasonal pr fields since examination must be very detailed to discern differences with WFDEI fields and among the GCMs (see Fig. S4). This improvement is clearly quantified with the Taylor diagrams over the Sahel and Guinea areas in Fig. 5. For raw GCMs the standardized standard deviation is very scattered from 0.25 to more than 2. Spatial correlations are higher in the Sahel (from +0.7 to +0.95) than in Guinea area (from +0.2 to +0.8). The CDF-t bias correction is quite effective in removing these biases and bringing the raw data closer to WFDEI, with some small remaining discrepancies, higher than for tas. The ISIMIP bias correction is also effective due to the proximity between WFD and WFDEI (see also Table 2).
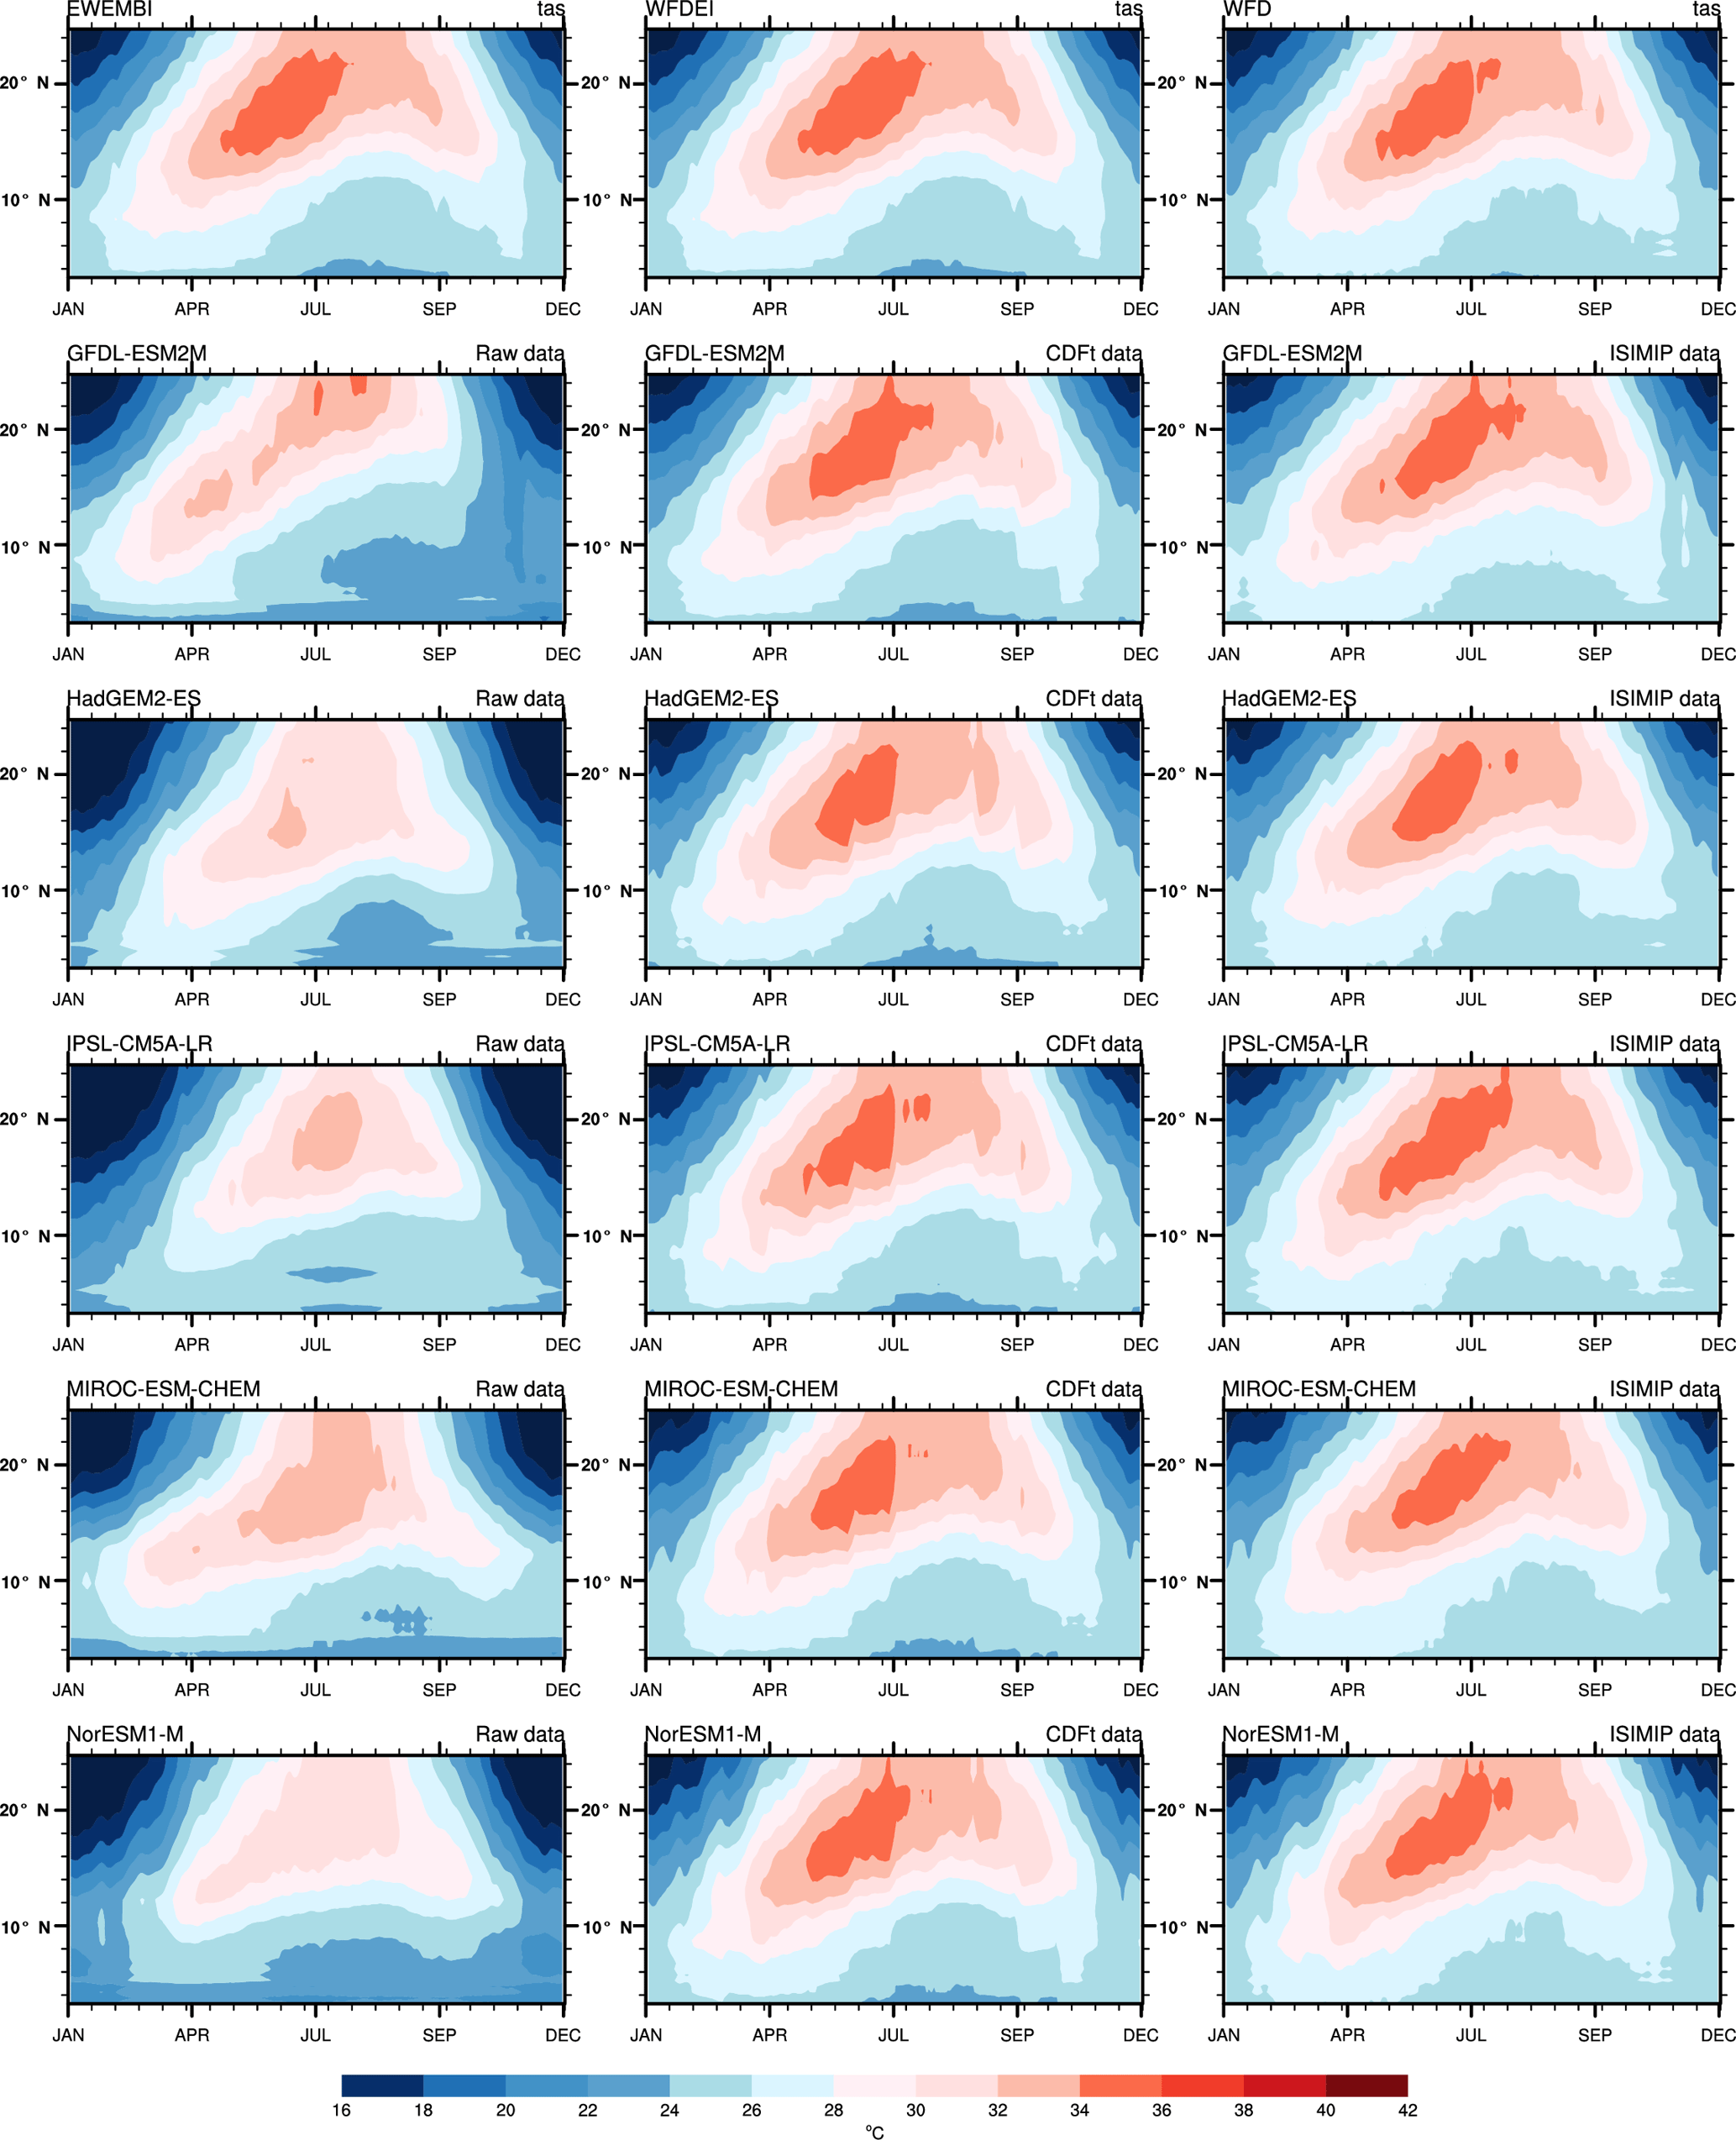
Figure 8Hovmöller diagrams of daily temperature (∘C) averaged between 15∘ W and 15∘ E and for the period 1979–2001 for EWEMBI, WFDEI, and WFD observations, each of the five GCMs for raw data (first column panels), CDF-t data (second column panels), and ISIMIP data (third column panels).
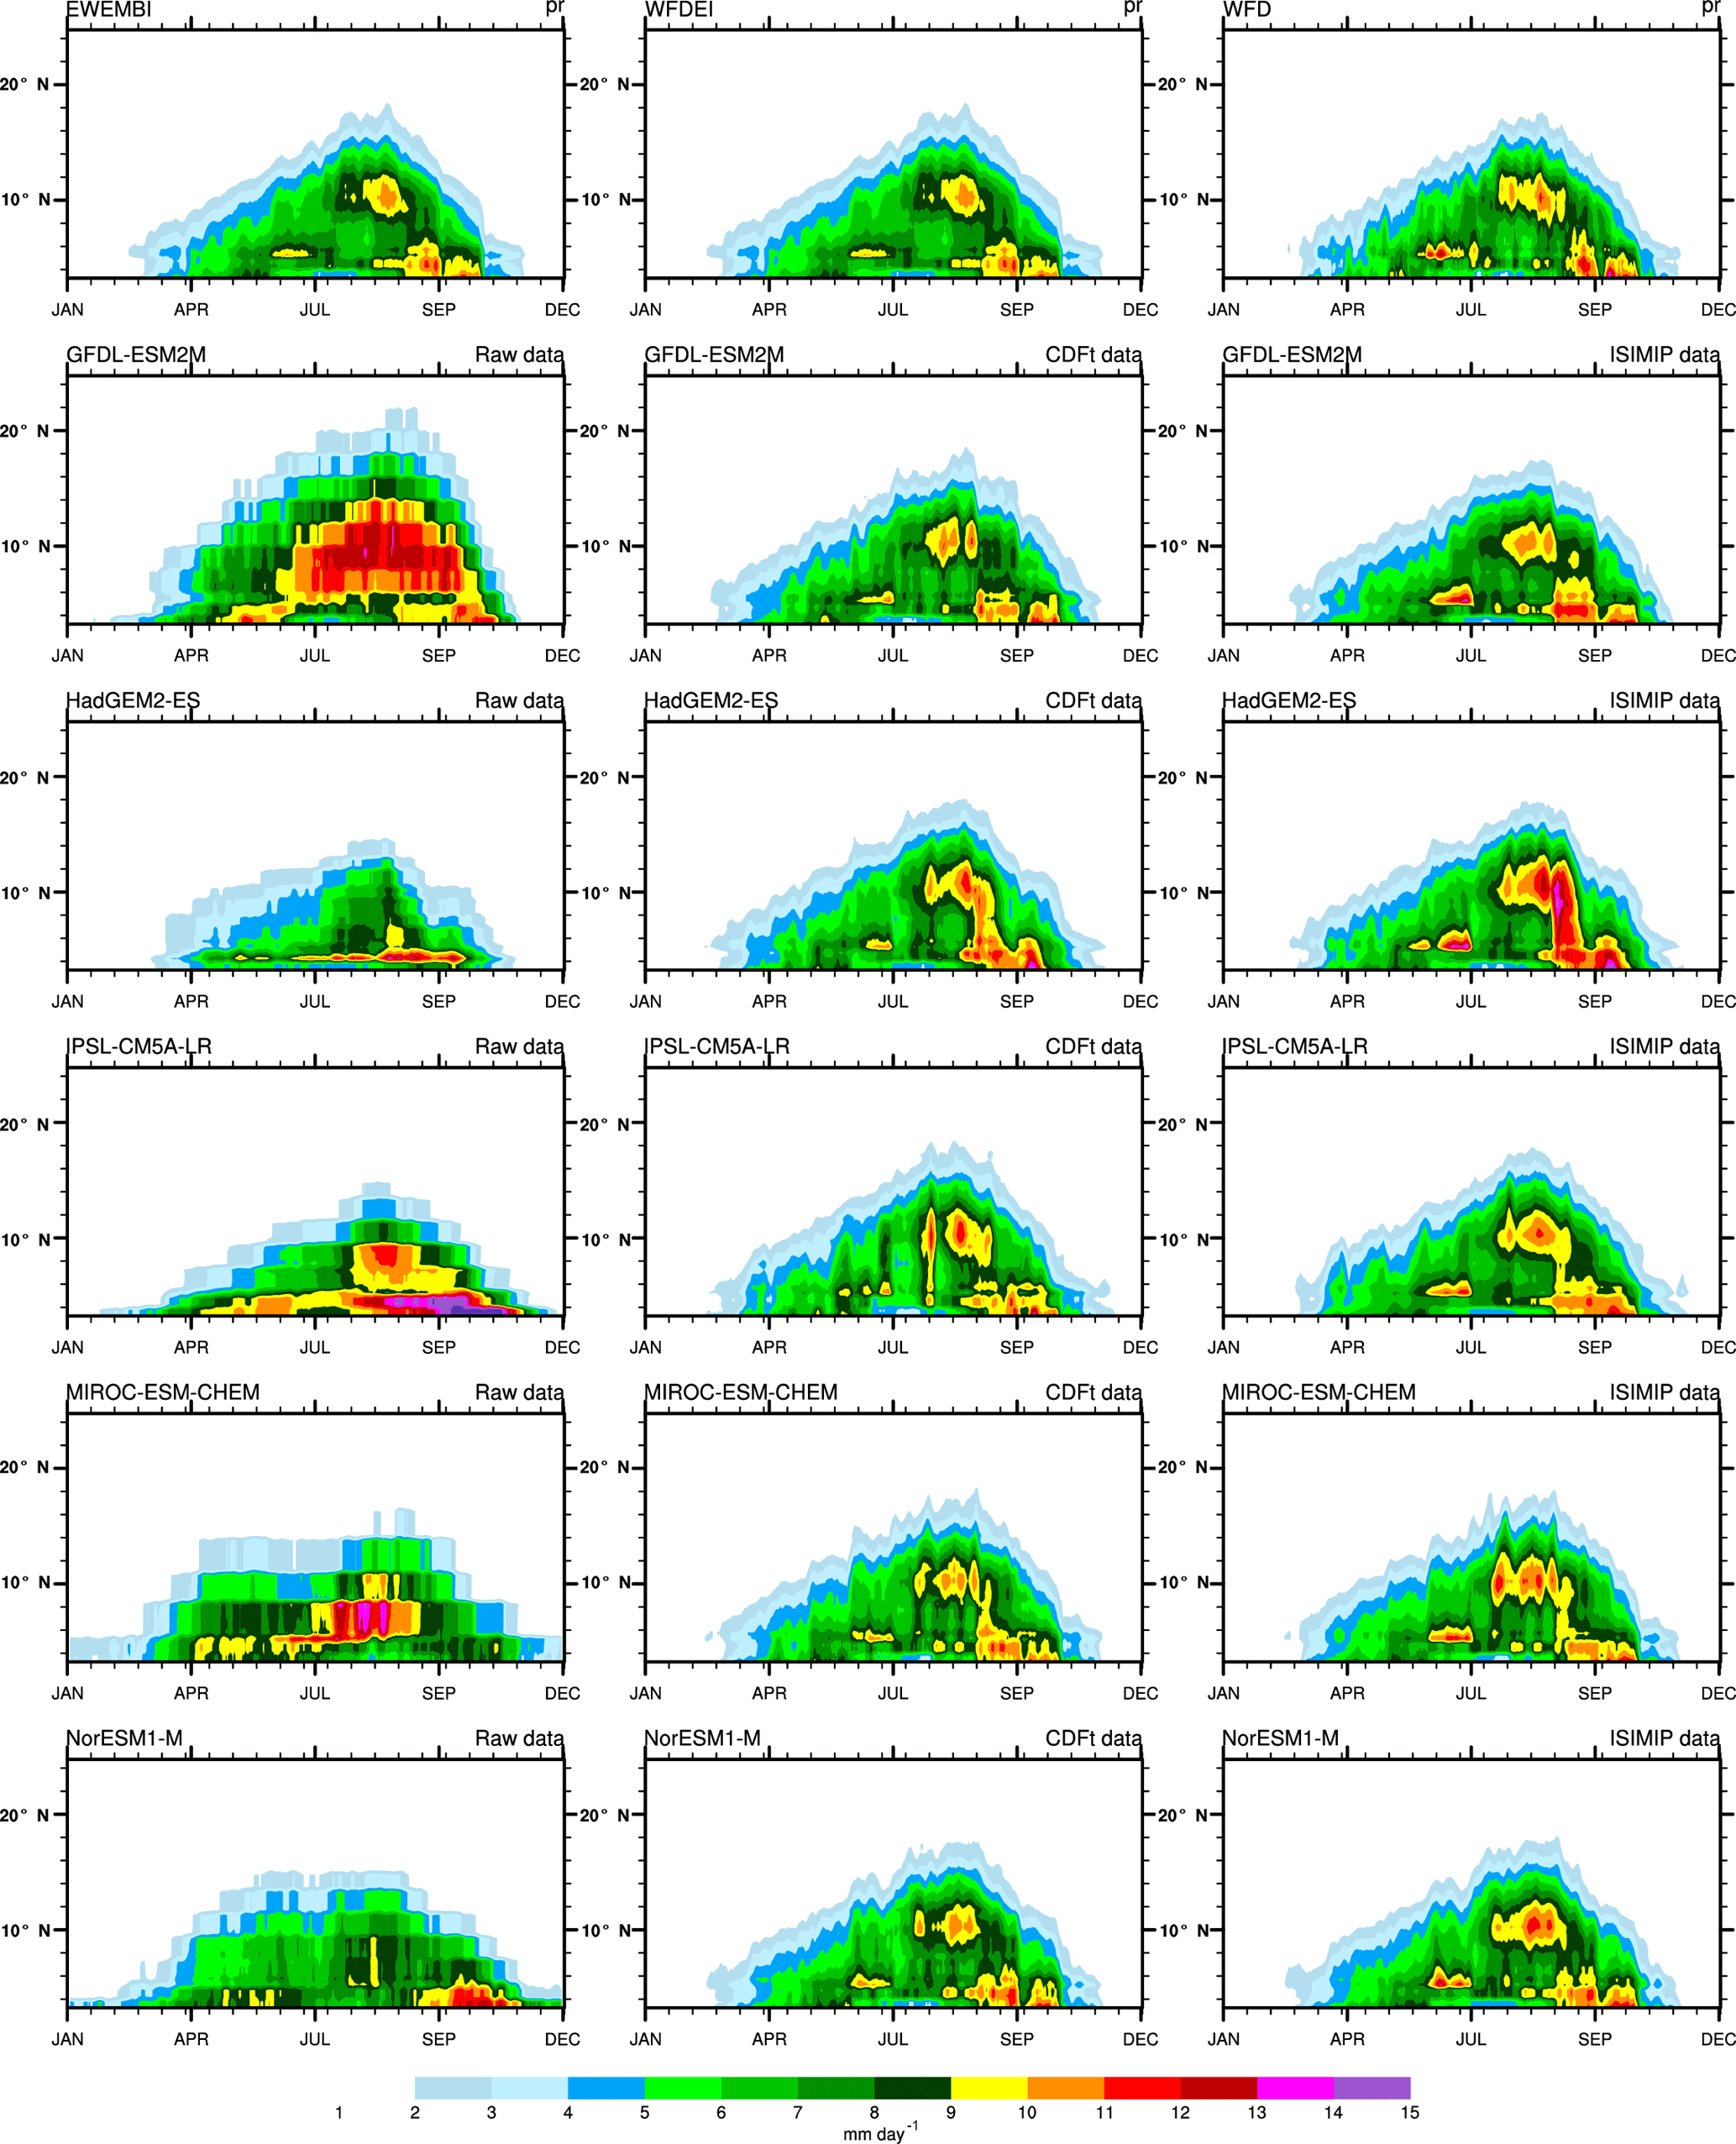
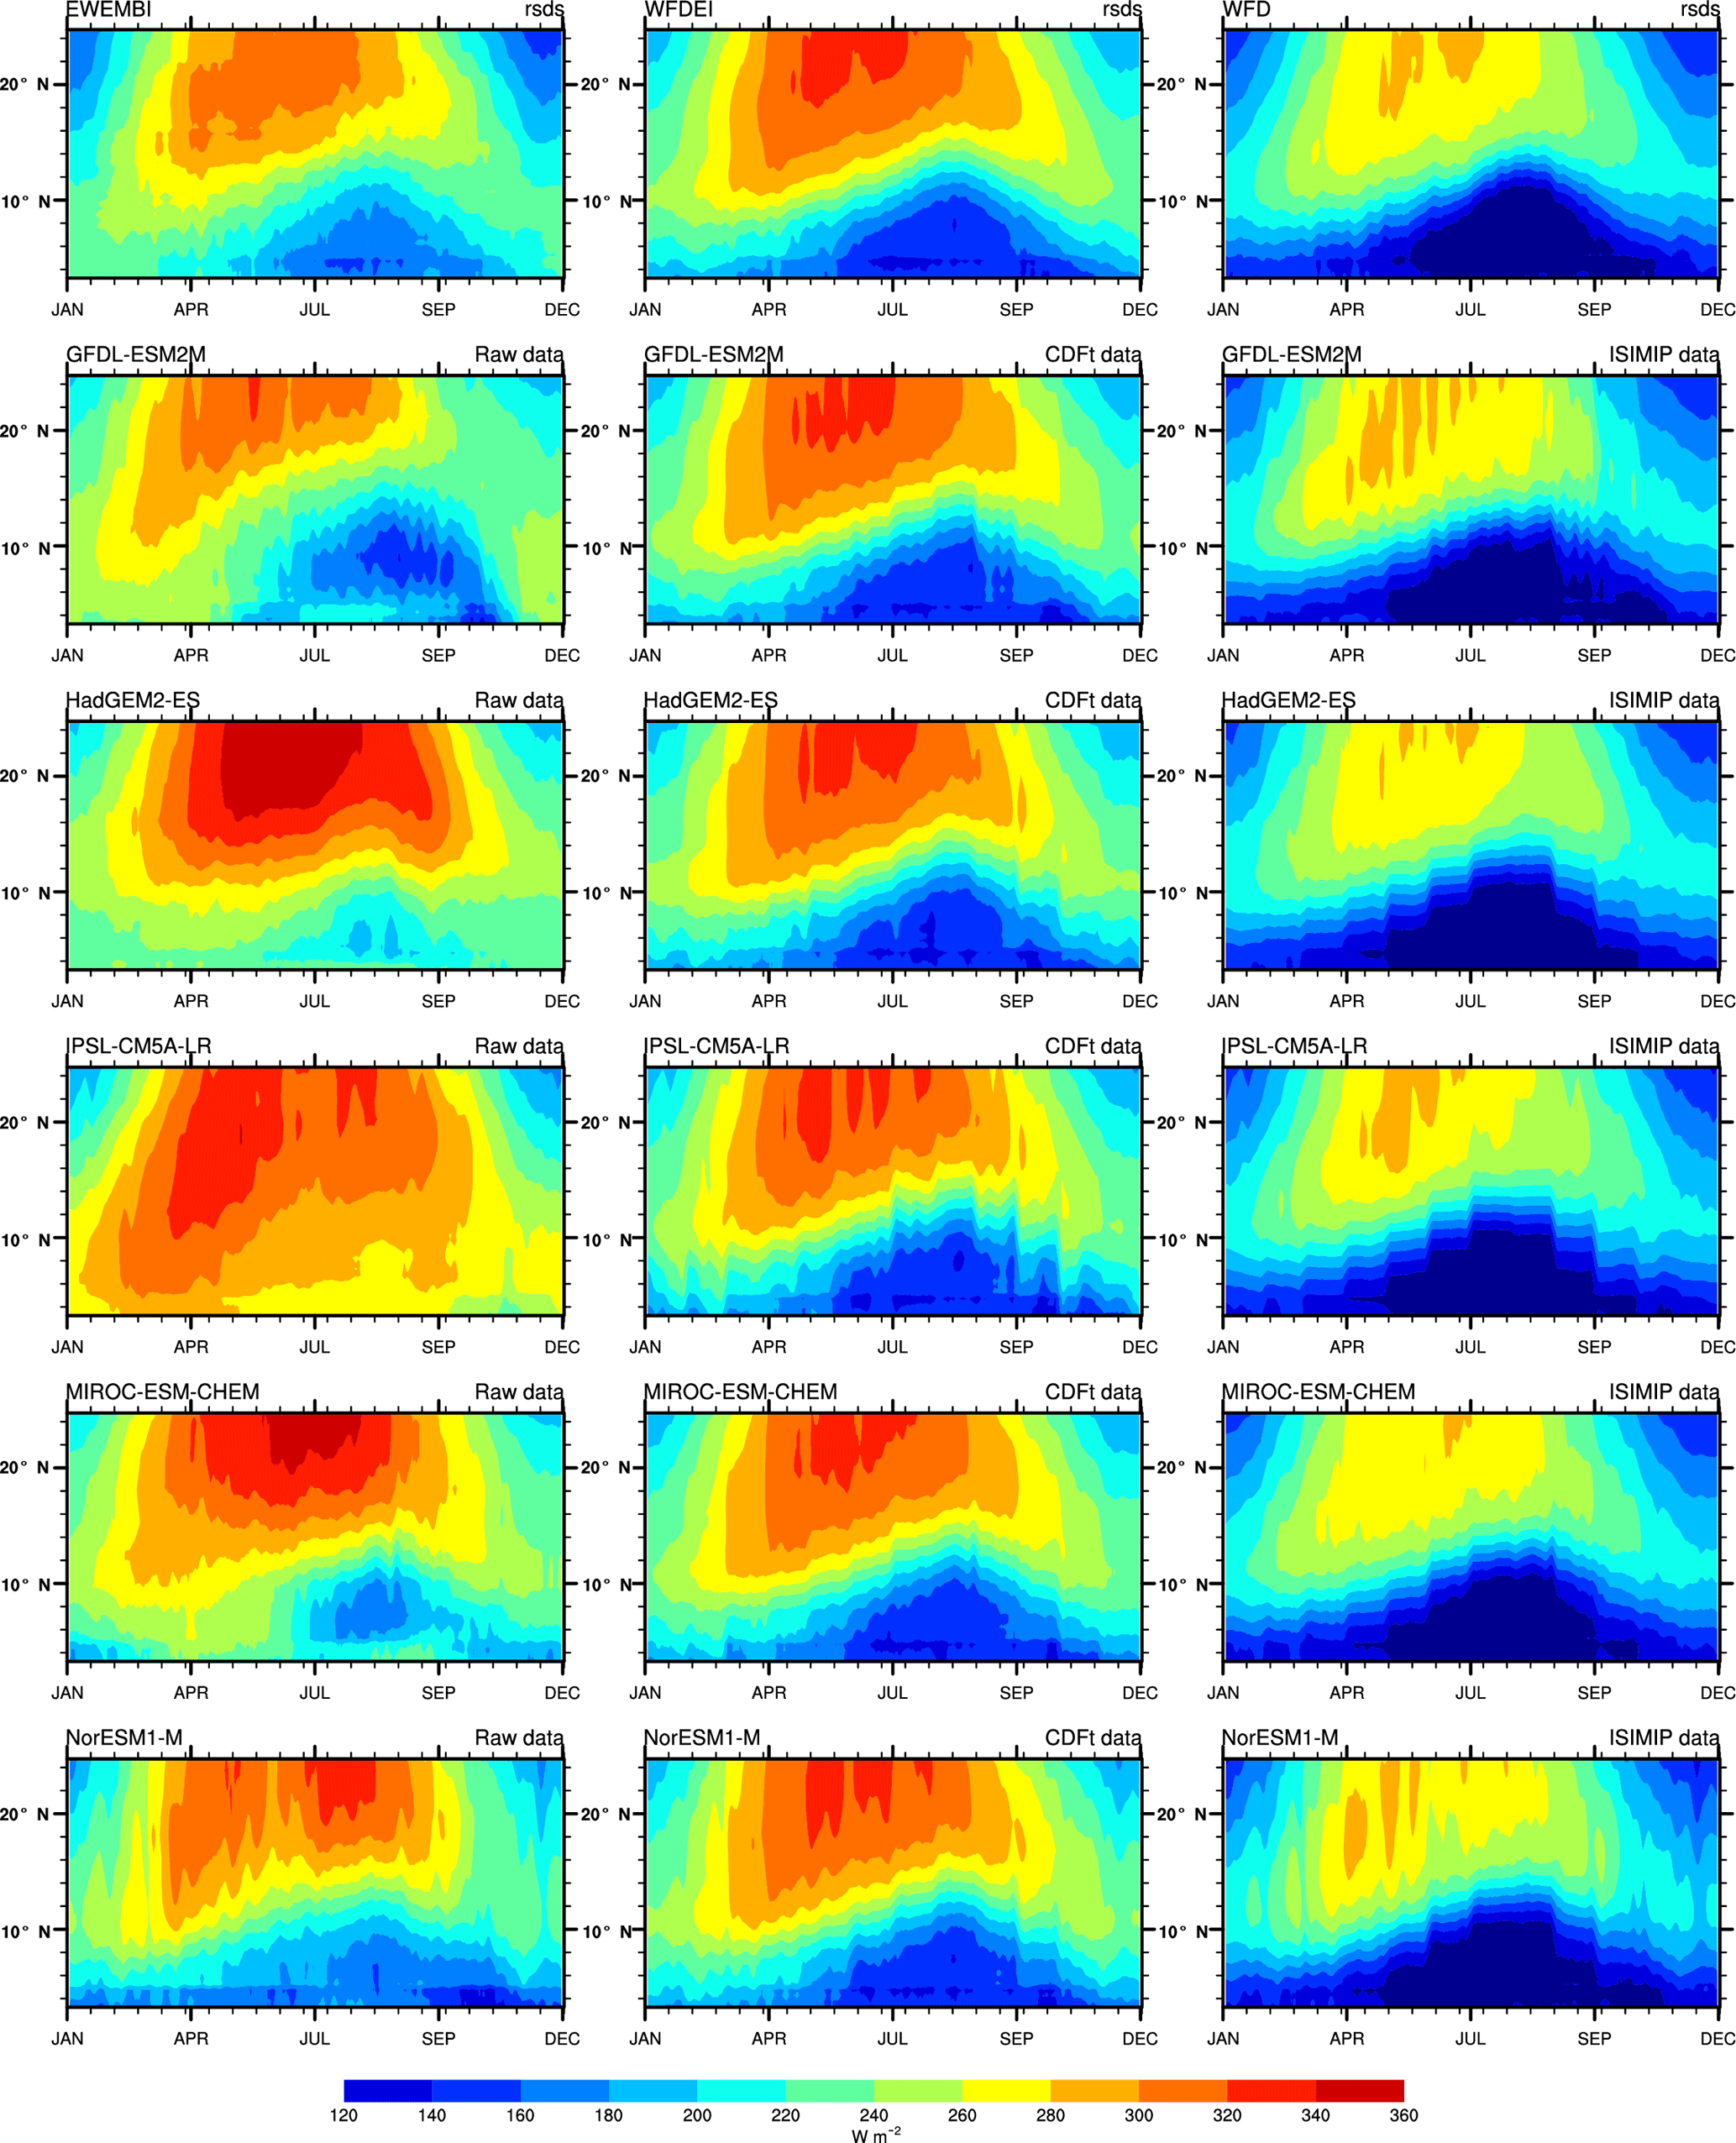

Figure 11The 95th percentile of daily values for temperature from various observation datasets in JAS: WFD (a), WFDEI (b), EWEMBI (c), and the difference relative to WFDEI data from five individual CDF-t bias-corrected models (d–h) over the period 1979–2001.
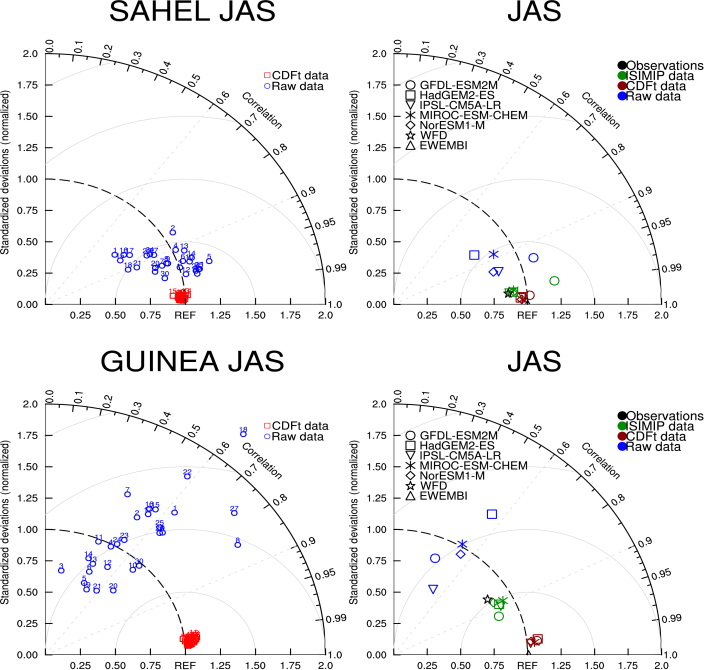
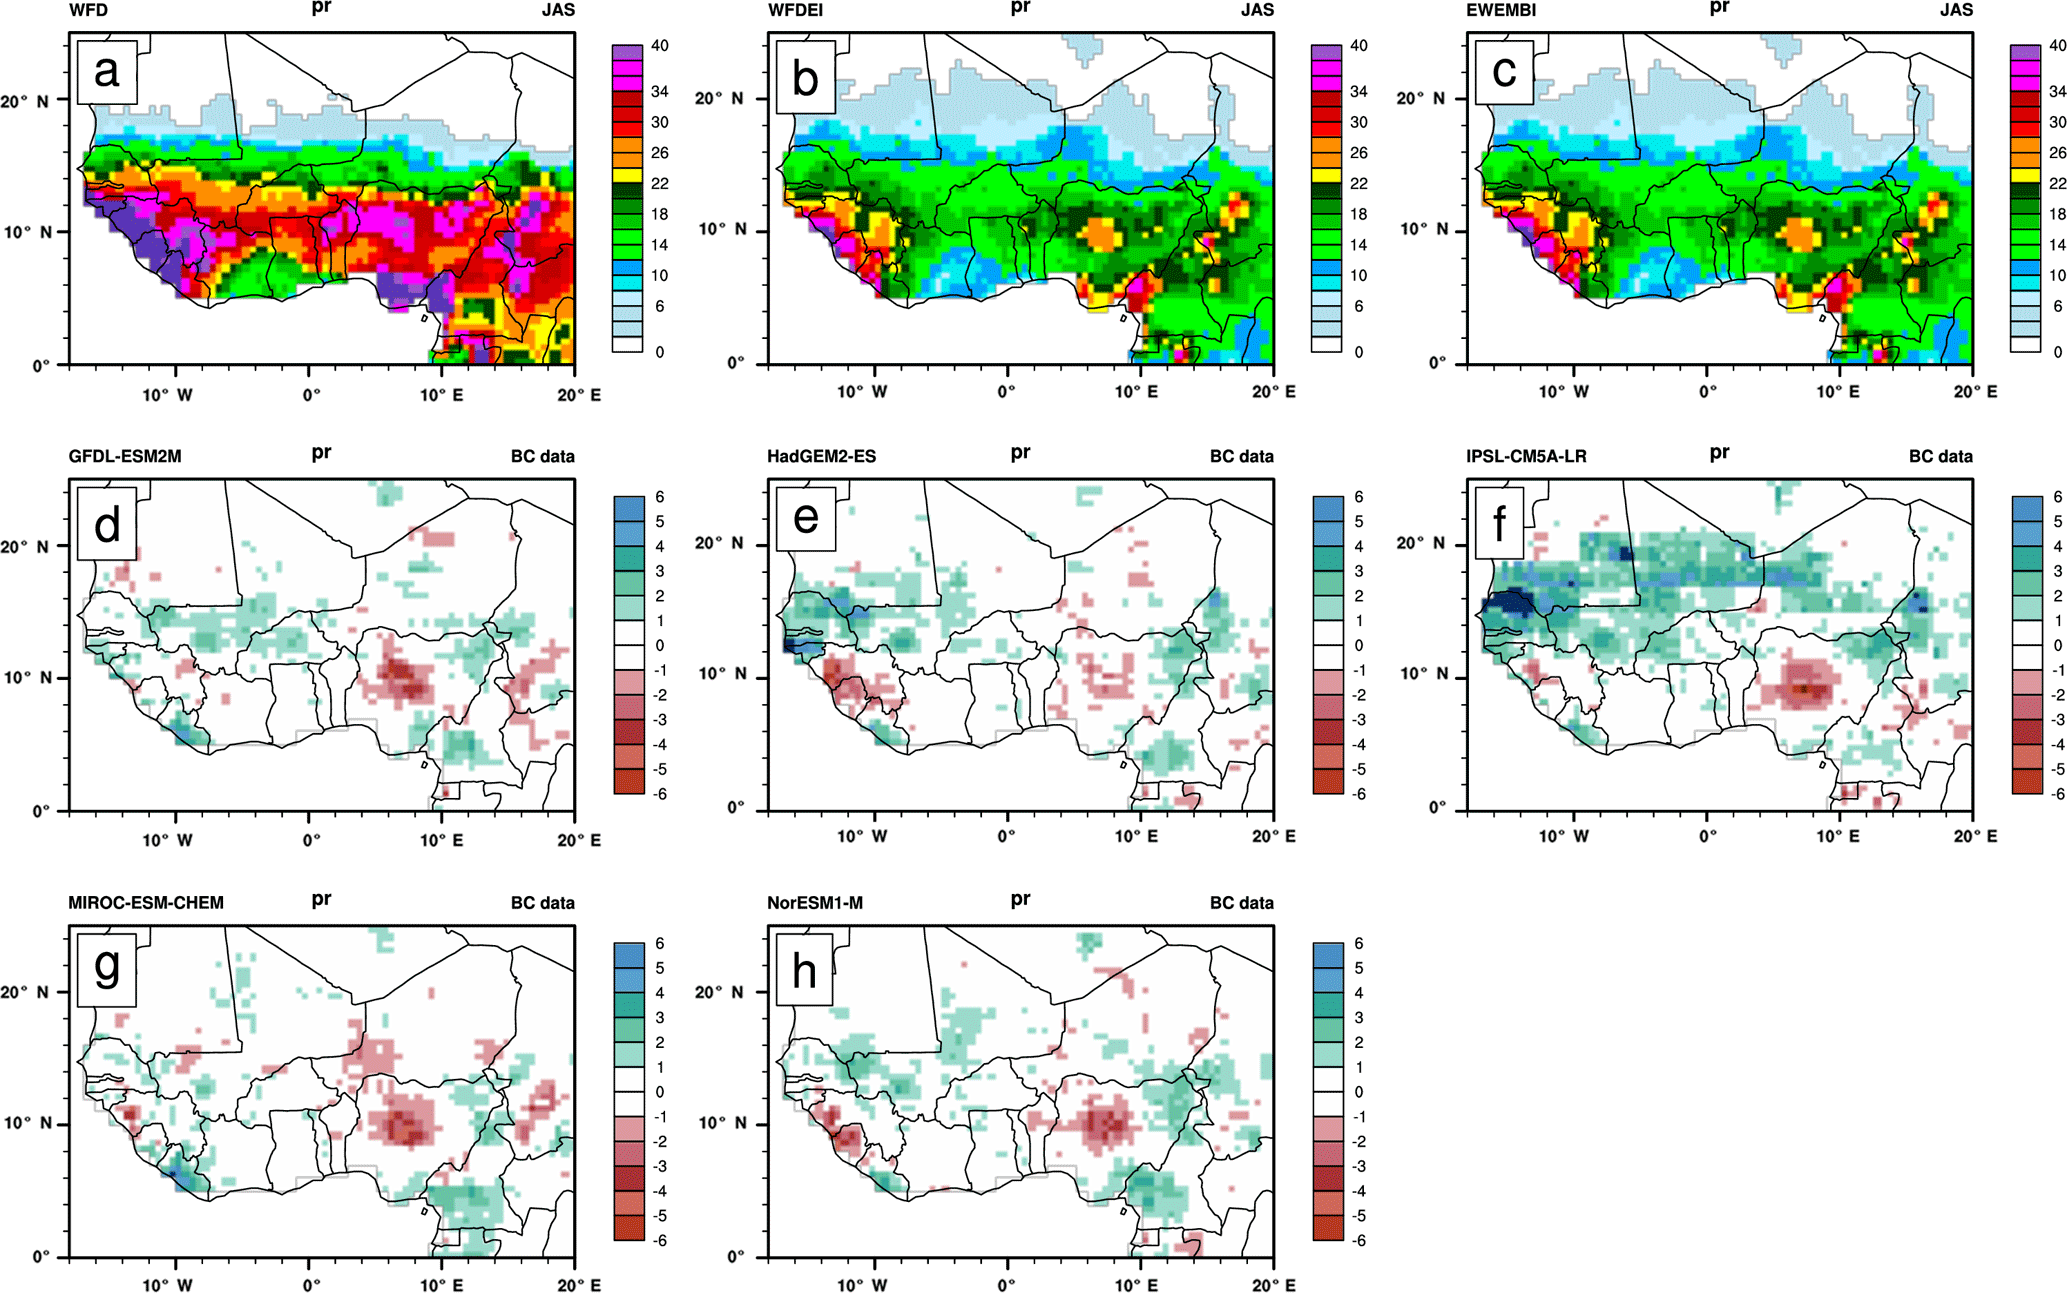
Figure 13The 95th percentile of daily precipitation rate (mm day−1) from various observation datasets in JAS: WFD (a), WFDEI (b), EWEMBI (c), and the difference relative to WFDEI data from five individual CDF-t bias-corrected models (d–h) over the period 1979–2001.

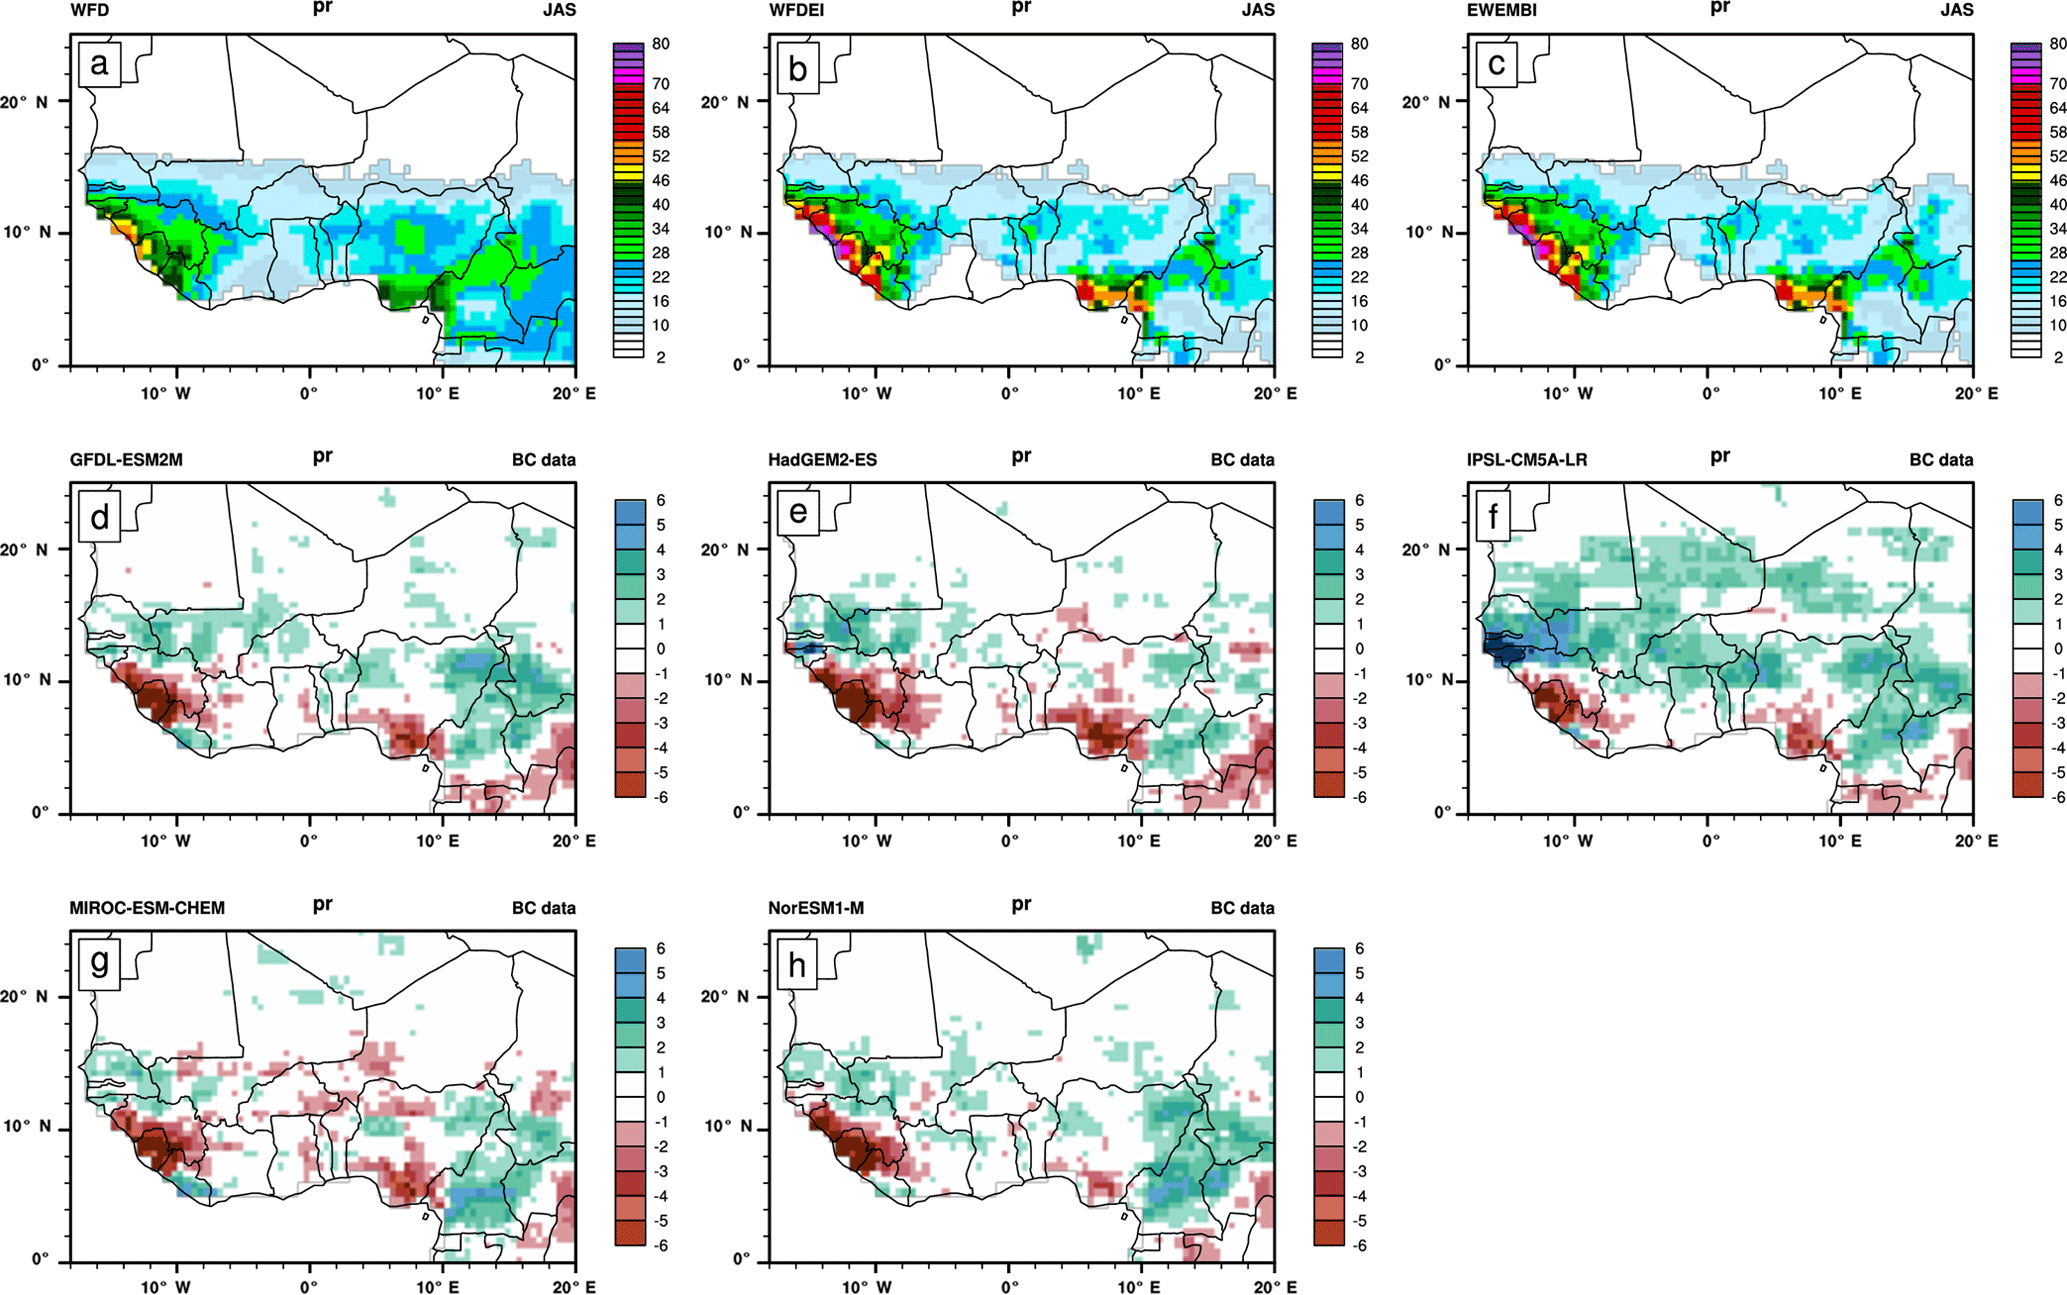
Figure 15Seasonal mean of number of days with precipitation greater than or equal to 10 mm day−1 from various observation datasets in JAS: WFD (a), WFDEI (b), EWEMBI (c), and the difference relative to WFDEI data from five individual CDF-t bias-corrected models (d–h) over the period 1979–2001.
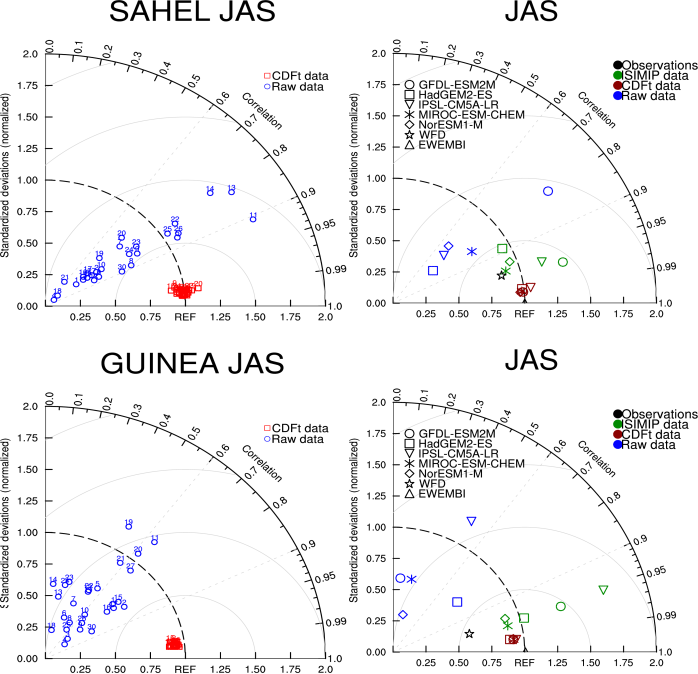
Figure 16Same as Fig. 3 but for the number of days when precipitation is greater than or equal to 10 mm day−1.
Figures 6, 7, and S5 show similar results, but for rsds. The mean seasonal field of WFDEI is a pattern with low values within the ITCZ area due to the high cloud coverage and high values for the Sahara due to low moisture and cloud coverage. We have noticed previously (Fig. 1) that high differences exist among WFDEI, WFD, and EWEMBI. WFD rsds values are the weakest and EWEMBI values the highest in the ITCZ area. WFD values are also the weakest and WFDEI values are a bit higher than for EWEMBI over the Sahara (see also Table 2). The five raw GCMs have, in agreement with their pr mean seasonal fields, a reasonable latitudinal evolution of low rsds values associated with the ITCZ, but the range of rsds differences with WFDEI data as well as the inter-GCM dispersion are very high. There is an overall positive bias over West Africa, except for GFDL-ESM2M. The CDF-t bias correction is once more very effective at removing biases in respect to WFDEI data (see Fig. S5). The Taylor diagrams (Fig. 7) provide some more quantification over the Sahel and Guinea areas. In terms of spatial correlation and normalized standard deviation in respect to WFDEI, raw GCMs have rather good performances over the Sahel (correlations higher than +0.8). Again, results are less good over the Guinea area (correlations less than +0.8) with a high dispersion of the GCMs. The ISIMIP bias correction highly reduces the inter-GCM dispersion around WFD, but WFD rsds data are a bit far from WFDEI rsds data. EWEMBI rsds data are also far from WFDEI. This is illustrated by the Taylor diagnostics using EWEMBI as “REF”. Bias-corrected data from both the CDF-t and ISIMIP methods stay far from EWEMBI and do not improve the performance of raw GCMs.
Figures 8 to 10 display other features of the mean fields in terms of Hovmöller diagrams computed over West Africa (15∘ W–15∘ E) for the whole year. They show the mean fields of EWEMBI, WFDEI, and WFD (first row) and of the five GCMs used in ISIMIP (rows 2 to 6) for raw data (first column), CDF-t bias-corrected data (second column), and the ISIMIP bias-correction method (third row). For tas (Fig. 8), the WFDEI, WFD, and EWEMBI fields are very similar and highlight the set-up of the high-temperature area associated with the Saharan heat low in spring and summer (Lavaysse et al., 2009). Raw GCMs show a similar timing but their temperature values are lower by 2 to 4 ∘C depending on the model and some increase in the northward progression around June that is not present in observations. Bias-correction methods are very effective at reducing these discrepancies but few differences still remain with WFDEI as for instance a bit weaker temperature maximum around July in CDF-t-corrected data. ISIMIP bias-corrected data are also very closer to WFD.
Figure 9 shows similar diagrams but for pr. The Hovmöller approach is a good way to depict the main characteristics of the ITCZ evolution over West Africa with a first rainy season during spring over the Guinea area followed by an abrupt jump to the north in June–July (Sultan and Janicot, 2003) and by a more progressive southward retreat at the end of the summer monsoon season, leading to a second weaker rainy season over the Guinean area in autumn. WFDEI and EWEMBI are quite similar. WFD fields are a bit noisier. Raw GCMs have high discrepancies and produce mean fields quite different from one model to another one. In particular, pr data can be either very low (HadGEM2-ES) or very high (GFDL-ESM2M), and no GCM captures the abrupt northward shift of the ITCZ well. The bias-correction methods (CDF-t using WFDEI, ISIMIP using WFD) are very effective in capturing back the main features of the ITCZ evolution. However, differences still remain among the GCMs, and ISIMIP-corrected GCMs have global rainfall maxima higher than CDF-t-corrected GCMs.
Figure 10 shows similar diagrams but for rsds. The seasonal evolution is in agreement with tas and pr fields and depicts high solar radiation values over the Sahara and weak values following the ITCZ latitudinal excursion but with a small southward lag (consistent with a higher cover of mid-level clouds; see Roehrig et al., 2013). WFD shows an overall negative bias with respect to WFDEI and EWEMBI, and WFDEI has a higher meridional gradient than EWEMBI with lower minimum values over the Guinea area and higher maximum values of the Sahara. The corrected GCM data are very close to their respective observation reference (WFD for ISIMIP, WFDEI for CDF-t), and hence different between their two respective corrected versions due to the differences between WFD and WFDEI.
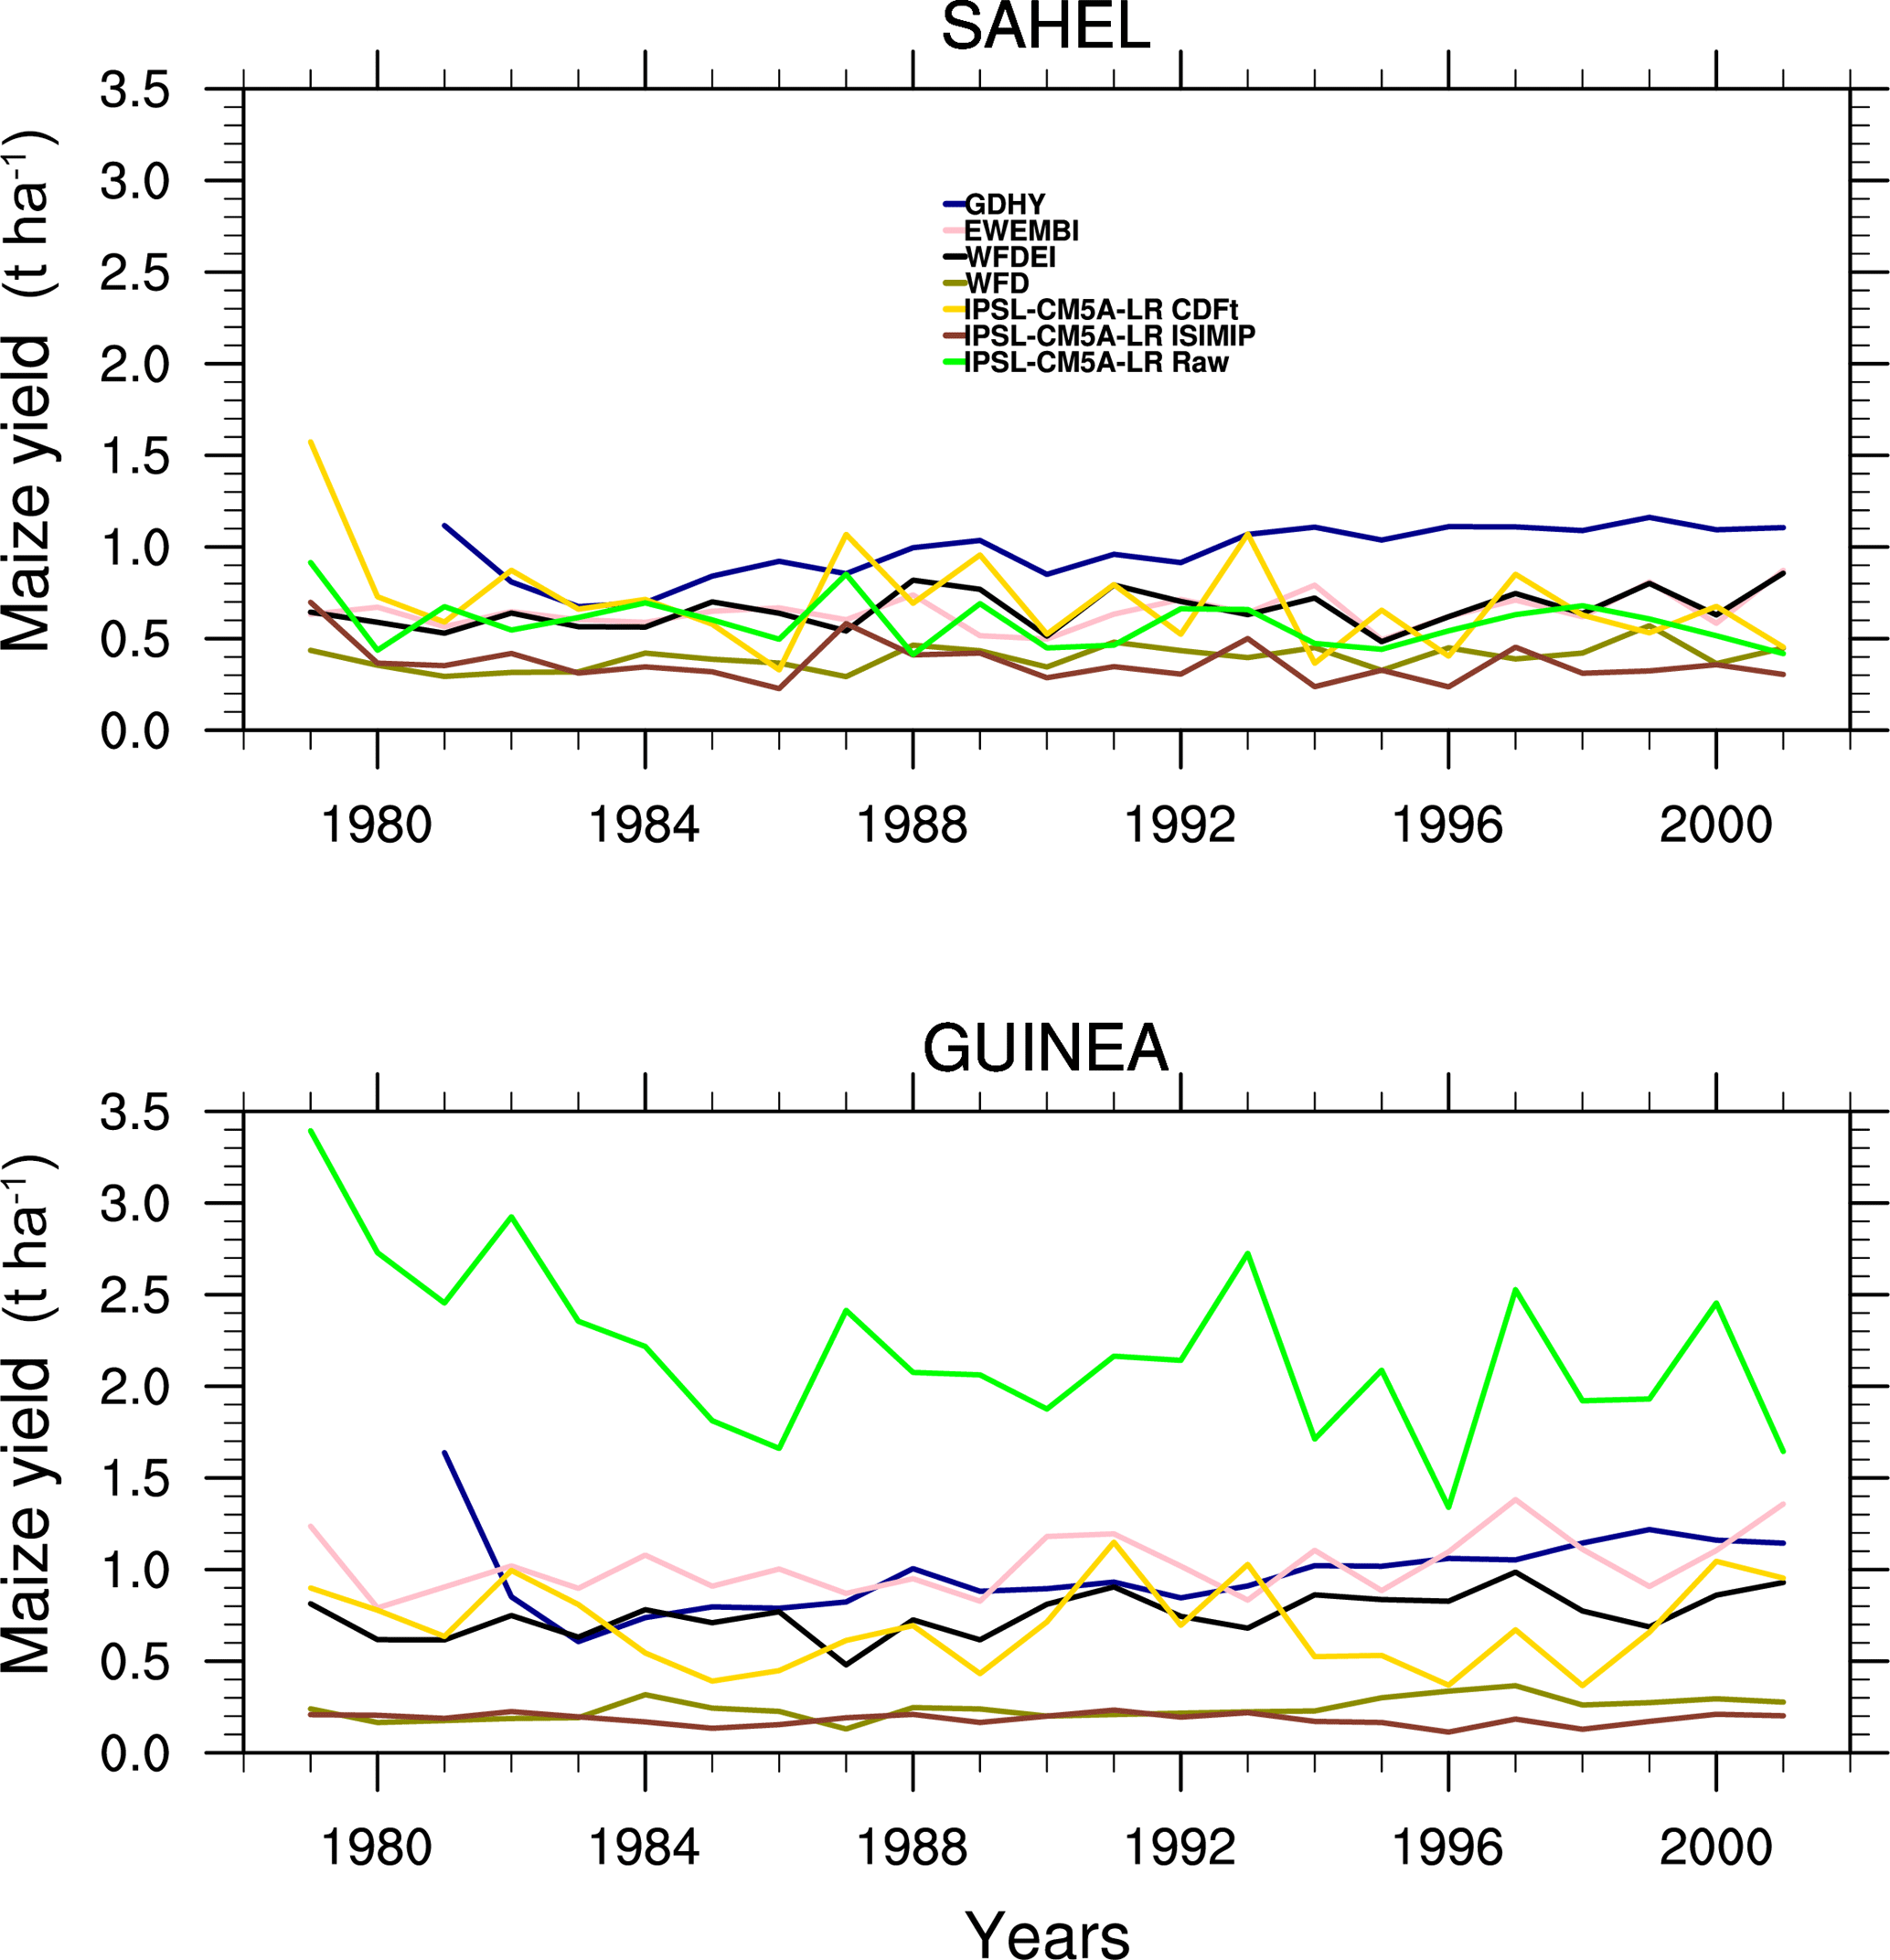
Figure 17Time series of crop maize yield over the Sahel (18∘ W–10∘ E; 10–20∘ N) and Guinea (18∘ W–10∘ E; 3–10∘ N) areas using IPSL-raw, IPSL-CDF-t, IPSL-ISIMIP, WFD, WFDEI, and EWEMBI as forcing data over 1979–2001.
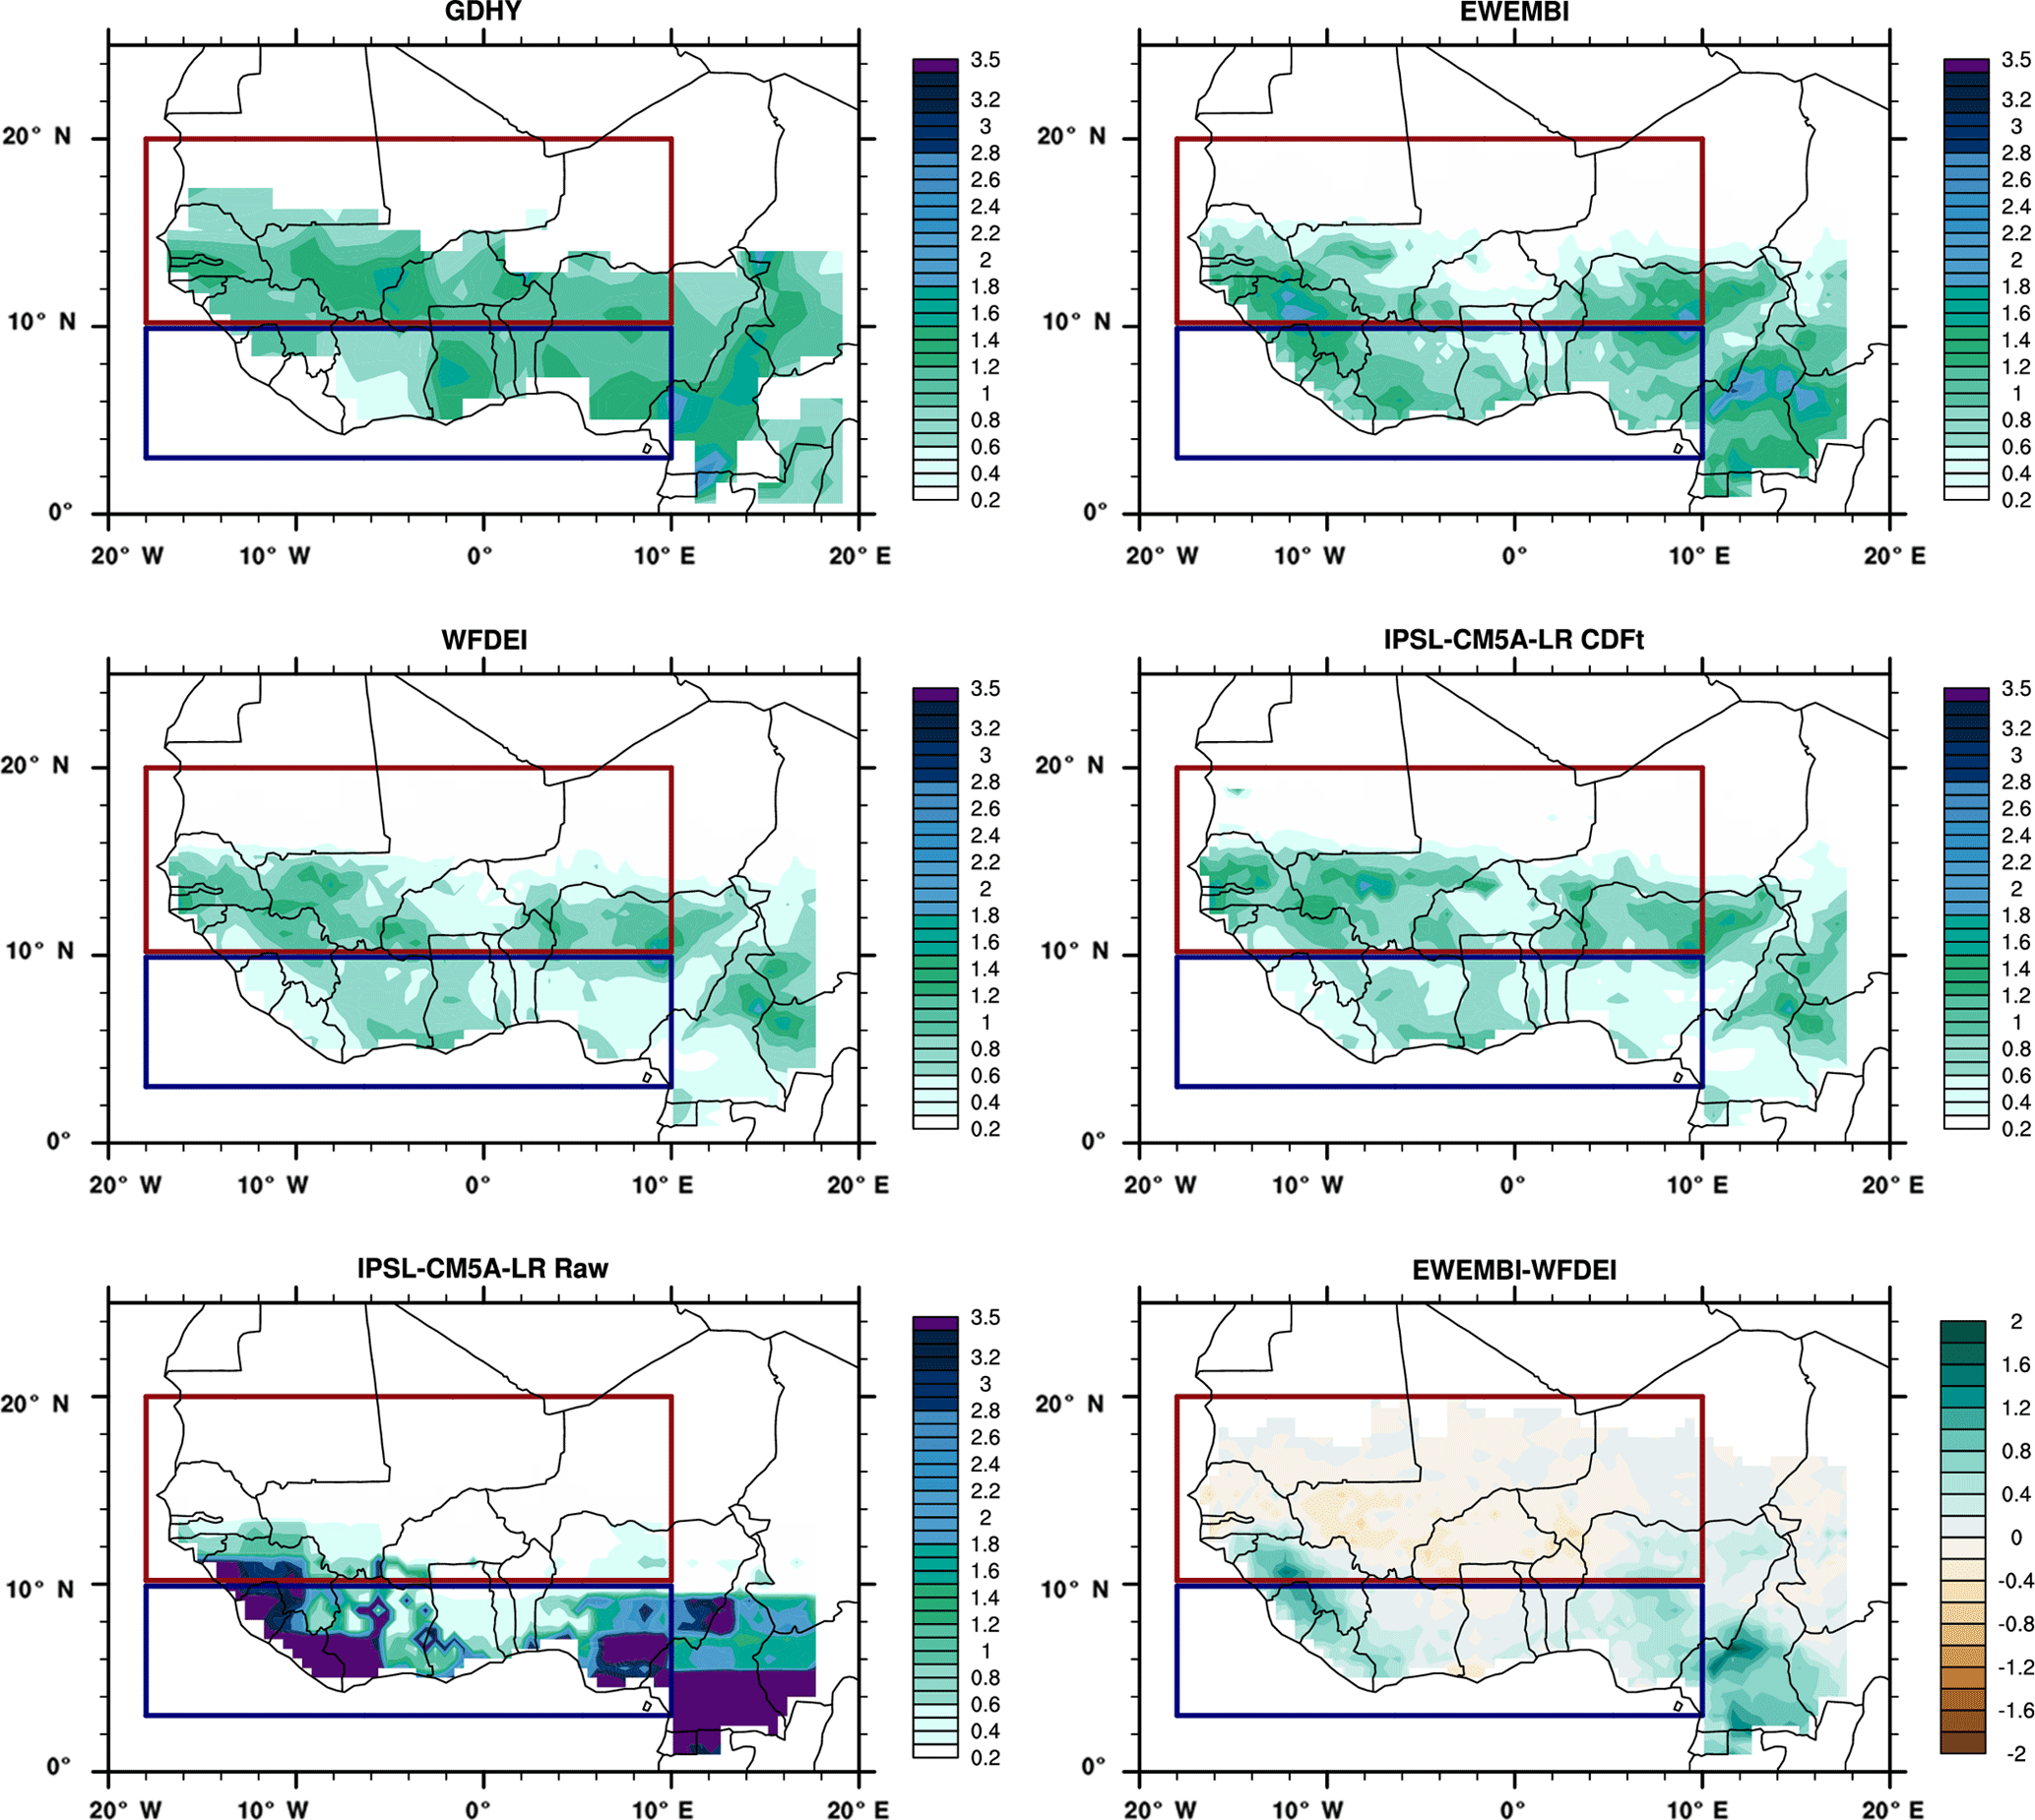
Figure 18Temporal mean of maize yield (t ha−1) for IPSL-raw, IPSL-CDF-t, WFDEI, EWEMBI, and GDHY over 1979–2001 and the difference between EWEMBI and WFDEI simulations. The boxes indicate the Sahel (18∘ W–10∘ E; 10–20∘ N) and Guinea (18∘ W–10∘ E; 3—10∘ N) regions.
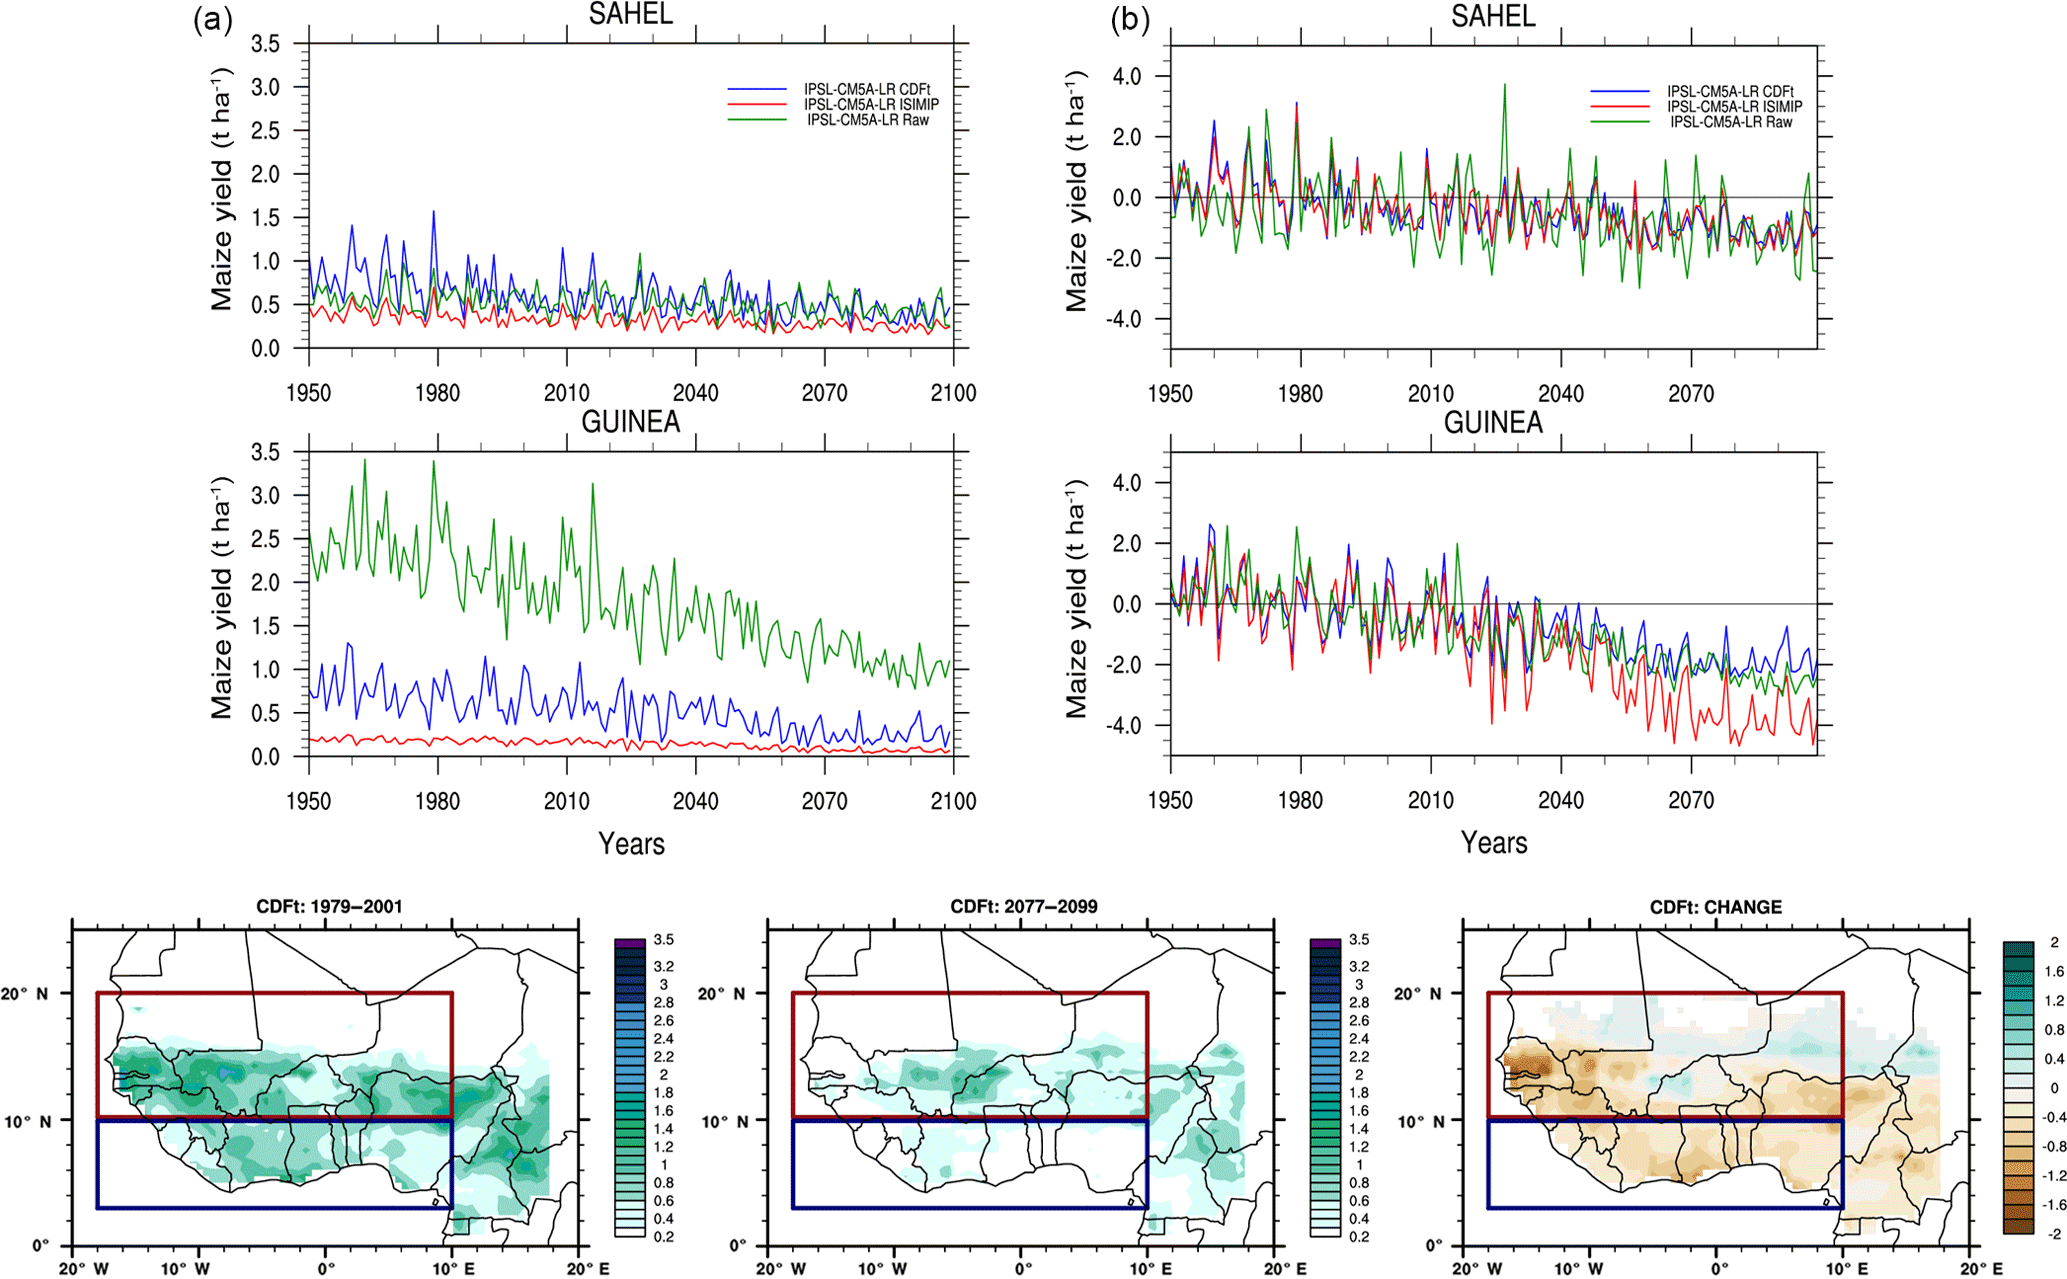
Figure 19Time series of RCP8.5 projections of maize yields over the Sahel (18∘ W–10∘ E; 10–20∘ N) and Guinea (18∘ W–10∘ E; 3–10∘ N) areas (a) and standardized yield anomalies with respect to 1979–2001 (b), using IPSL-CM5A-LR raw data (green line), BC data with CDF-t (blue line), and ISIMIP BC data (red line) as forcing data. Maps show mean maize yields from CDF-t bias-corrected data over 1979–2001, 2077–2099, and their difference.
4.3 Daily metrics over West Africa
In the following, similar diagnostics are presented to evaluate the selected daily metrics. To reduce the number of figures in the core of the paper, some of them are presented in the Supplement (three metrics in the core of the paper, three others in the Supplement). A more complete metrics report is available at http://www.amma2050.org/content/climate-metrics.
Figures 11 and 12 shows the results for the tas 95th percentile of daily values of near-surface air temperature. WFD, WFDEI, and EWEMBI provide similar values in summer (Fig. 11; see also Table 2) with the highest values over the Sahara in spring (up to 40 ∘C, not shown), moving northward in summer, and with weaker values in autumn (up to 32 ∘C; not shown). WFD values appear to be a bit higher than the two other reference datasets. More to the south, in the Guinea area, the 95 % percentile is between 30 and 34 ∘C. CDF-t bias-corrected data are also presented for the five GCMs used in ISIMIP in terms of differences relative to WFDEI. Some biases still remain but mostly lower than 1 ∘C in absolute value. They are generally negative over the Sahara except for GFDL-ESM2M. The Taylor diagrams again depict the good performance of the CDF-t bias-correction method here for extreme values. The highly scattered raw GCM data, especially over the Guinea area, move into a concentrated zone very near the WFDEI reference (Fig. 12). ISIMIP bias-corrected data are also well concentrated near the WDF reference data but at some distance from the WFDEI reference point. Here again, EWEMBI is superimposed to REF (see also Table 2), and bias-corrected GCMs are closer to REF for Sahel than for Guinea area.
Figures 13 and 14 provide similar analysis for the 95th percentile of daily pr. WFD, WFDEI, and EWEMBI provide fields consistent with the ITCZ location including high values over the mountain areas (Fig. 13). WFDEI and EWEMBI have very similar fields while the range of values for WDF is very different, with values higher than 30 mm day−1 in the ITCZ in summer in contrast with values lower than 20 mm day−1 for the two other reference datasets (see also Table 2). A similar range of differences is present over the Guinea area in spring and to a lesser extent in autumn (not shown). Such differences are also large over the mountain areas (Fouta Djalloon, Cameroon). CDF-t bias-corrected GCM data have remaining weak biases relative to WFDEI, lower than ±2 mm day−1, except for IPSL-CM5A-LR, where differences up to +5 mm day−1 are located north of 10∘ N. Compared to the 95th percentile of daily tas, Taylor diagrams (Fig. 14) again show the good performance of the CDF-t bias-correction method for the 29 GCMs, but with a bit higher distance to REF for both the Sahel and Guinea areas. ISIMIP bias-corrected GCM data are more scattered than CDF-t-corrected GCMs in relation to their respective reference dataset, WFD and WFDEI, and WFD is located far from the WFDEI REF in terms of normalized standard deviation and centred RMSE (see also Table 2).
Finally, Figs. 15 and 16 provide similar analysis for the number of days with pr > 10 mm day−1. WFD, WFDEI, and EWEMBI provide values consistent with the ITCZ location including high values over the mountain areas (Fig. 15). In contrast to the previous metric, WFD has a more similar range of values relative to WFDEI and EWEMBI, with some overestimation, especially over Nigeria, Cameroon, and central Africa. The spatial variance is higher than for the two previous metrics with a higher contrast between mountain and plain areas. Remaining biases in the CDF-t-corrected data are localized over mountain areas with mostly negative biases, but also over plains with mostly positive biases in the ITCZ area and especially extended for IPSL-CM5A-LR. Taylor diagrams (Fig. 16) once more show a good performance of the CDF-t correction method to remove biases and reduce inter-GCM dispersion. ISIMIP bias-corrected GCMs have a higher dispersion than CDF-t-corrected GCMs relative to their respective reference dataset.
4.4 Crop yield simulations and sensitivity to bias-corrected variables
The sensitivity of simulated crop yields over West Africa to raw and bias-corrected forcing data is now evaluated. A crop model forced by atmospheric variables integrates biases and variability in these forcing data in a non-linear way. This integration may reduce or amplify the variability induced from these forcing data.
This has been tested by using the crop model SARRA-O (System of Agroclimatological Regional Risk Analysis; version O). The model simulates yield attainable under water-limited conditions by simulating the soil water balance, potential and actual evapotranspiration, phenology, potential and water-limited carbon assimilation, and biomass partitioning (Kouressy et al., 2008). The simulation of these processes makes SARRA-O particularly suited for the analysis of climate impacts on cereal growth and yield in dry tropical environments (Sultan et al., 2013). Several sensitivity simulations have been carried out. First SARRA-O has been forced for each year from 1979 to 2001 by WFD, WFDEI, and EWEMBI data. Second, the IPSL-CM5A-LR model has been used to force SARRA-O over the same years, with raw, CDF-t bias-corrected, and ISIMIP bias-corrected data. The simulations have been compared to the “GDHY” dataset (1981–2001) of 1.125∘ gridded yield estimation. GDHY is a hybrid of FAO country yield data, satellite-derived crop-specific vegetation index and global crop datasets on crop calendar, harvested area, and production shares achieved by different growing season. Subnational yield statistics have been used to validate the grid-cell yield estimates (Iizumi et al., 2014). Note that SARRA-O provides potential yields that can be different from observed yields, so this comparison with the GDHY dataset must be considered as indicative only. Finally, sensitivity to individual variables has been conducted by comparing the SARRA-O simulation forced with WFDEI data with simulations where one WFDEI variable is replaced by the corresponding raw IPSL-CM5A-LR data.
Figure 17 compares the simulated crop yields over the Sahel and Guinea areas when SARRA-O is forced either by WFD, WFDEI, or EWEMBI and by the raw, CDF-t, or ISIMIP bias-corrected IPSL-CM5A-LR model. GDHY data are also shown as an evaluation. Over the Guinea area, the differentiation of ensembles of simulations is quite clear. The raw IPSL-CM5A-LR simulation has the highest yields (∼ 2200 kg ha−1) while WFD and associated ISIMIP bias-corrected simulations have the lowest yields (∼ 240 and 180 kg ha−1 respectively). The four remaining simulations, based on WFDEI and associated CDF-t bias-corrected data and EWEMBI and GDHY data, have intermediate yields, between 700 and 1000 kg ha−1. Thus it is shown first that SARRA-O maize yields are quite sensitive to the different forcing datasets, second that WFD lead to simulated yields far from the GDHY data while WFDEI and EWEMBI leads to quite better yields, and finally that the raw GCM and GCM corrected with WFD are also quite far from the validation data while the GCM corrected with WFDEI has a rather good performance. The simulation forced by EWEMBI has a higher mean value than WFDEI (∼ 760 and 1030 kg ha−1 respectively), and GDHY has yields ranging between WFDEI and EWEMBI (∼ 980 kg ha−1), close to EWEMBI. Over the Sahel area, the curves are closer but some similar conclusions can be drawn. WFD and associated ISIMIP bias-corrected simulations provide the lowest yields (∼ 400 and 370 kg ha−1 respectively). WFDEI, EWEMBI, and CDF-t bias-corrected simulations are very close (∼ 660, 650, and 710 kg ha−1 respectively). Finally, in contrast to the Guinea area, GDHY data have the highest yields (∼ 980 kg ha−1), far from other simulations. The raw simulation (∼ 590 kg ha−1) is close to the WFDEI, EWEMBI, and CDF-t bias-corrected simulations. This last point is quite surprising since raw IPSL-CM5A-LR data have large biases.
Table 3Sensitivity experiment means and biases (kg ha−1) in respect to WFDEI simulations for the Sahel and Guinea areas. Simulations of sensitivity to individual variables have been conducted by forcing the SARRA-O model with WFDEI data and by replacing one of the WFDEI variables with the corresponding raw IPSL-CM5A-LR data. These variables are pr, rsds, tasmin, and tasmax, and also rsds from ISIMIP bias-corrected IPSL-CM5A-LR (using WFD as a reference).
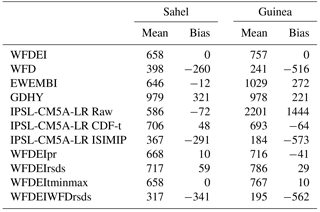
Figure 18 shows the maps of mean simulated yields for raw IPSL-CM5A-LR, WFDEI, and CDF-t bias-corrected EWEMBI simulations, GDHY data, and the difference between EWEMBI and WFDEI simulations. For raw simulations, yields are highly underestimated over the central Sahel but highly overestimated over the western Sahel and especially near the Fouta Djalloon. The boundary between the Sahel and Guinea areas being at 10∘ N, the spatial average over the Sahel combine positive and negative biases in respect to WFDEI. This explains the point raised at the end of the previous paragraph. The other maps show that yields obtained from EWEMBI are closer to GDHY data than yields from WFDEI, mostly due to better realistic values over the Guinea area (see also Table 3). Yields from EWEMBI are higher than yields from WFDEI mostly south of 10∘ N. Underestimation of yields simulated from WFDEI over Fouta Djalloon, southern Cameroon, and south-eastern Nigeria can be clearly associated with underestimation of WFDEI rsds compared to EWEMBI rsds (see Fig. 1). Comparisons of WFDEI and EWEMBI interannual time series of yields and associated tas, pr, and rsds on individual grid points in these areas confirm that these yield differences are linked exclusively to rsds differences. Finally, maps of simulated yields from WFD and ISIMIP bias correction confirm the weak values over all of West Africa due to an underestimation of rsds south of 10∘ N (not shown).
To go further, a sensitivity analysis to individual variables has been conducted by comparing the SARRA-O simulation forced with WFDEI data with simulations where one of these WFDEI variables is replaced by the corresponding raw IPSL-CM5A-LR data. These variables are pr, rsds, tasmin, and tasmax, and also rsds from ISIMIP bias-corrected IPSL-CM5A-LR (using WFD as reference). Table 3 shows the mean yields for the Sahel and Guinea areas and the resulting biases relative to WFDEI simulations. Biases are very weak with tasmin–tasmax simulations (WFDEItminmax), a bit higher for pr simulations (WFDEIpr) and for rsds simulations (WFDEIrsds) and drastically large for rsds from ISIMIP bias-corrected simulations (WFDEIWFDrsds). Thus rsds appears as a very critical variable for maize yields simulated with SARRA-O, confirming a previous study based on an older version, SARRA-H, of the crop model (Oettli et al., 2011).
SARRA-O has also been run over the period 1950–2099 using the RCP8.5 projection, forced by ISPL-CM5A-LR in terms of raw, CDF-t bias-corrected, and ISIMIP bias-corrected data. Figure 19 shows, on the one hand, the resulting time series of maize yields over the Sahel and Guinea boxes and, on the other hand, the maps of yields from CDF-t bias-corrected data over 1979–2001 and 2077–2099 and the resulting difference between these two periods. Time series of standardized yield anomalies to their respective mean over 1979–2001 are also displayed. In agreement with the previous analysis, ISIMIP bias-corrected forcing data (with WFD as reference data) lead to the lowest yields over both the Sahel and Guinea areas at the present time but also over the whole 21st century. Over the Guinea area, the very high simulated yields coming from raw data are drastically reduced with CDF-t bias-corrected forcing data (with WFDEI as reference data) while over the Sahel area these yields are rather similar. After CDF-t bias correction, yields are quite similar over the two areas. Interannual variability in simulated yields is proportional to the mean with a very weak variability for ISIMIP yield and higher variability for CDF-t and raw simulations. More precisely, standardized yield anomalies (right panels) have a similar range over the Sahel, around 1 standard deviation after 2060, and a range around 2 standard deviations after 2070 over the Guinea area, except for ISIMIP yields, which reach 4 standard deviations. All projections show a clear decrease in maize yields by a factor of ∼ 2 over all of West Africa for the 21st century. The map of the difference between 2077–2099 and 1979–2001 shows that the yield decrease is located mostly south of 13∘ N, except between Mali and Niger, and that a slight increase is present north of 13∘ N.
The objectives of this paper are (i) to introduce a new bias-corrected dataset for which the CDF-t correction method has been applied to CMIP5 GCM daily data for the first time over Africa, (ii) to quantify the effect of using different reference datasets on the corrected data, (iii) and to illustrate this effect on crop simulations over West Africa. This bias correction has been applied over the period 1950–2099, combining historical runs and RCP scenarios with 29/27/20 GCMs for RCP8.5/4.5/2.6 respectively. It has been applied to six variables critical for agricultural impacts: daily accumulated pr, daily mean, minimum and maximum near-surface air temperature, daily mean surface downwelling shortwave radiation, and daily mean wind speed.
The use of different bias-correction methods also based on different reference datasets contributes to the total uncertainty in climate projections and can contribute in some contexts more than the use of different GCMs or RCMs (Iizumi et al., 2017). So using multiple bias-correction techniques and reference datasets is highly recommended. In this context, CDF-t bias-corrected GCM data have been compared to the five GCMs ISIMIP bias-corrected data, and the impact of the different reference datasets, WFD (used in ISIMIP bias corrections), WFDEI (used in CDF-t bias corrections), and the more recent EWEMBI (used in a second version of ISIMIP bias corrections), has been examined in detail. Crop simulations have also been carried out to test how the impact of bias corrections in forcing data (temperature, pr, rsds) is integrated in terms of crop (maize) yields. Finally, bias corrections have also been presented in the context of RCP8.5 scenarios.
The whole observational period, 1979–2013, has been chosen to calibrate the bias-correction process. It has been shown that using various calibration sub-periods has a weak impact, in particular on the time evolution over the 21st century.
The evaluation of CDF-t bias correction applied to the 29 GCMs, both to mean seasonal data and to daily metrics, has shown that CDF-t is very effective in removing the biases in respect to the reference WFDEI data and in reducing the high inter-GCM scattering. It has also shown some distance, depending on variables and metrics, from bias-corrected ISIMIP GCM data, mainly due to the differences between WFDEI and WFD reference data. WFDEI (and associated CDF-t bias-corrected GCMs) appears closer to EWEMBI than WFD (and associated ISIMIP bias-corrected GCMs). Metrics based on temperature are very close for the three reference datasets, and some differences exist in pr-based metrics. In contrast, significant differences have been highlighted in terms of rsds. This has consequences in terms of crop (maize) yields over West Africa. Sensitivity simulations performed with one GCM have shown that bias corrections improve the yields simulated by the raw GCM. However, the ISIMIP bias-corrected GCM still underestimate them as CDF-t bias-corrected GCMs do but with yield estimates closer to observed ones. EWEMBI provides the closest yields to observed estimates. This is mainly due to rsds whose values are underestimated in WFDEI south of 10∘ N. Finally, in agreement with maize yield sensitivity simulations, projections of future yields over West Africa have quite different levels depending on the bias-correction method. However, they all show a similar relative decreasing trend over the 21st century.
The main perspective of this work is to go on exploring the uncertainty linked to bias-correction methods and their associated reference data in RCP climate scenarios by producing a second version of this bias-corrected 29-GCM ensemble over Africa using more recent reference data like EWEMBI or others like those used in AgMIP based on other reanalyses (AgMERRA or AgCFSR; Ruane et al., 2015). The main divergence among all those reference datasets is probably expected from rsds. Bias correction for other variables useful for user-based metrics like specific humidity is also scheduled. Comparison between CDF-t and ISIMIP bias-correction methods based on the same reference dataset is also ongoing.
The CFD-t bias correction has been applied independently for each of the six variables. However, this may be a problem since existing spatial coherency and dependence among variables may be destroyed by the application of univariate calibrations. Recently, to address this issue, improved calibrations have been developed in terms of multivariate correction and spatial and/or temporal dependences (Vrac and Friederichs, 2015). Implementation of more sophisticated methods using multivariate correction is also ongoing.
This work constitutes a first step in producing bias-corrected datasets over Africa within AMMA-2050. An atlas is in preparation that will provide extensive results over Africa to the FCFA stakeholders and end-user communities. These communities will be accompanied by FCFA climate scientists in order to be aware of the way to use these data and their limitations.
The ISIMIP Fast Track data are available at https://doi.org/10.5880/PIK.2016.001 (Hempel et al., 2013b) and the EWEMBI dataset at https://doi.org/10.5880/pik.2016.004 (Lange, 2016). The CDF-t bias-corrected CMIP5 data over Africa are available at http://amma2050.ipsl.upmc.fr/. To access the data, users must contact the lead author at moflod@locean-ipsl.upmc.fr.
The supplement related to this article is available online at: https://doi.org/10.5194/esd-9-313-2018-supplement.
The authors declare that they have no conflict of interest.
The research leading to these results has received partial funding from the
NERC/DFID Future Climate For Africa programme under the AMMA-2050 project,
grant number NE/M019934/1. The lead author has been also supported by IRD.
Mathieu Vrac has been partly funded by the ANR StaRMIP project. We acknowledge the
World Climate Research Programme's Working Group on Coupled Modelling, which
is responsible for CMIP, and we thank the climate modelling groups (listed in
Table 1 of this paper) for producing and making their model output available.
For CMIP the US Department of Energy's Program for Climate Model Diagnosis
and Intercomparison provides coordinating support and led development of
software infrastructure in partnership with the Global Organization for Earth
System Science Portals. The authors also thank the EU Watch project and its
members for data availability and ISIMIP data.
Edited by: Somnath Baidya Roy
Reviewed by: Toshichika Iizumi and one anonymous referee
Dee, D. P., Uppala, S. M., Simmons, A. J., Berrisford, P., Poli, P., Kobayashi, S., Andrae, U., Balmaseda, M. A., Balsamo, G., Bauer, P., Bechtold, P., Beljaars, A. C. M., van de Berg, L., Bidlot, J., Bormann, N., Delsol, C., Dragani, R., Fuentes, M., Geer, A. J., Haimberger, L., Healy, S. B., Hersbach, H., Hólm, E. V., Isaksen, L., Kållberg, P., Köhler, M., Matricardi, M., McNally, A. P., Monge-Sanz, B. M., Morcrette, J.-J., Park, B.-K., Peubey, C., de Rosnay, P., Tavolato, C., Thépaut, J.-N., and Vitart, F.: The ERA-Interim reanalysis: configuration and performance of the data assimilation system, Q. J. Roy. Meteorol. Soc., 137, 553–597, https://doi.org/10.1002/qj.828, 2011. a
Déqué, M.: Frequency of precipitation and temperature extremes over France in an anthropogenic scenario: model results and statistical correction according to observed values, Global Planet. Change, 57, 16–26, 2007. a, b
Dutra, E.: Report on the current state-of-the-art Water Resources Reanalysis, Tech. rep. D.5.1, EartH2Observe, available at: http://earth2observe.eu/files/Public Deliverables/D5.1_Report on the WRR1 tier1.pdf (last access: March 2018), 2015. a
Frieler, K., Lange, S., Piontek, F., Reyer, C. P. O., Schewe, J., Warszawski, L., Zhao, F., Chini, L., Denvil, S., Emanuel, K., Geiger, T., Halladay, K., Hurtt, G., Mengel, M., Murakami, D., Ostberg, S., Popp, A., Riva, R., Stevanovic, M., Suzuki, T., Volkholz, J., Burke, E., Ciais, P., Ebi, K., Eddy, T. D., Elliott, J., Galbraith, E., Gosling, S. N., Hattermann, F., Hickler, T., Hinkel, J., Hof, C., Huber, V., Jägermeyr, J., Krysanova, V., Marcé, R., Müller Schmied, H., Mouratiadou, I., Pierson, D., Tittensor, D. P., Vautard, R., van Vliet, M., Biber, M. F., Betts, R. A., Bodirsky, B. L., Deryng, D., Frolking, S., Jones, C. D., Lotze, H. K., Lotze-Campen, H., Sahajpal, R., Thonicke, K., Tian, H., and Yamagata, Y.: Assessing the impacts of 1.5 ∘C global warming – simulation protocol of the Inter-Sectoral Impact Model Intercomparison Project (ISIMIP2b), Geosci. Model Dev., 10, 4321–4345, https://doi.org/10.5194/gmd-10-4321-2017, 2017. a
Hagemann, S., Chen, C., Haerter, J. O., Heinke, J., Gerten, D., and Piani, C.: Impact of a statistical bias correction on the projected hydrological changes obtained from three GCMs and two hydrology models, J. Hydrometeorol., 12, 556–578, 2011. a
Hempel, S., Frieler, K., Warszawski, L., Schewe, J., and Piontek, F.: A trend-preserving bias correction – the ISI-MIP approach, Earth Syst. Dynam., 4, 219–236, https://doi.org/10.5194/esd-4-219-2013, 2013a. a
Hempel, S., Frieler, K., Warszawski, L., Schewe, J., and Piontek, F.: Bias corrected GCM input data for ISIMIP Fast Track, GFZ Data Services, https://doi.org/10.5880/PIK.2016.001, 2013b. a
Iizumi, T., Yokozawa, M., Sakurai, G., Travasso, M. I., Romanenkov, V., Oettli, P., Newby, T., Ishigooka, Y., and Furuya, J.: Historical changes in global yields: major cereal and legume crops from 1982 to 2006, Global Ecol. Biogeogr., 23, 346–357, 2014. a
Iizumi, T., Takikawa, H., Hirabayashi, Y., Hanasaki, N., and Nishimori, M.: Contributions of different bias-correction methods and reference meteorological forcing data sets to uncertainty in projected temperature and precipitation extremes, J. Geophys. Res.-Atmos., https://doi.org/10.1002/2017JD026613, in press, 2017. a, b
Kallache, M., Vrac, M., Naveau, P., and Michelangeli, P.-A.: Nonstationary probabilistic downscaling of extreme precipitation, J. Geophys. Res.-Atmos., 116, D05113, https://doi.org/10.1029/2010JD014892, 2011. a
Kouressy, M., Dingkuhn, M., Vaksmann, M., and Heinemann, A. B.: Adaptation to diverse semi-arid environments of sorghum genotypes having different plant type and sensitivity to photoperiod, Agr. Forest Meteorol., 148, 357–371, 2008. a
Lange, S.: EartH2Observe, WFDEI and ERA-Interim data Merged and Bias-corrected for ISIMIP (EWEMBI), GFZ Data Services, https://doi.org/10.5880/pik.2016.004, 2016. a, b
Lange, S.: ISIMIP2 bias-correction fact sheet, http://www.isimip.org (last access: March 2018), 2017a. a
Lange, S.: Bias correction of surface downwelling longwave and shortwave radiation for the EWEMBI dataset, Earth Syst. Dynam. Discuss., https://doi.org/10.5194/esd-2017-81, in review, 2017b. a, b
Lavaysse, C., Flamant, C., Janicot, S., Parker, D. J., Lafore, J.-P., Sultan, B., and Pelon, J.: Seasonal evolution of the West African heat low: a climatological perspective, Clim. Dynam., 33, 313–330, https://doi.org/10.1007/s00382-009-0553-4, 2009. a
Lavaysse, C., Vrac, M., Drobinski, P., Lengaigne, M., and Vischel, T.: Statistical downscaling of the French Mediterranean climate: assessment for present and projection in an anthropogenic scenario, Nat. Hazards Earth Syst. Sci., 12, 651–670, https://doi.org/10.5194/nhess-12-651-2012, 2012. a
Meehl, G. A., Boer, G. J., Covey, C., Latif, M., and Stouffer, R. J.: The coupled model intercomparison project (CMIP), B. Am. Meteorol. Soc., 81, 313–318, 2000. a
Michelangeli, P.-A., Vrac, M., and Loukos, H.: Probabilistic downscaling approaches: Application to wind cumulative distribution functions, Geophys. Res. Lett., 36, L11708, https://doi.org/10.1029/2009GL038401, 2009. a, b
Moss, R. H., Edmonds, J. A., Hibbard, K. A., Manning, M. R., Rose, S. K., Van Vuuren, D. P., Carter, T. R., Emori, S., Kainuma, M., Kram, T., Meehl, G. A., Mitchell, J. F. B., Nakicenovic, N., Riahi, K., Smith, S. J., Stouffer, R. J., Thomson, A. M., Weyant, J. P., and Wilbanks, J.: The next generation of scenarios for climate change research and assessment, Nature, 463, 747–756, 2010. a
Oettli, P., Sultan, B., Baron, C., and Vrac, M.: Are regional climate models relevant for crop yield prediction in West Africa?, Environ. Res. Lett., 6, 014008, https://doi.org/10.1088/1748-9326/6/1/014008, 2011. a, b
Roehrig, R., Bouniol, D., Guichard, F., Hourdin, F., and Redelsperger, J.-L.: The present and future of the West African monsoon: a process-oriented assessment of CMIP5 simulations along the AMMA transect, J. Climate, 26, 6471–6505, 2013. a, b
Ruane, A. C., Goldberg, R., and Chryssanthacopoulos, J.: Climate forcing datasets for agricultural modeling: Merged products for gap-filling and historical climate series estimation, Agr. Forest Meteorol., 200, 233–248, 2015. a
Stackhouse Jr., P. W., Gupta, S. K., Cox, S. J., Zhang, T., Mikovitz, J. C., and Hinkelman, L. M.: The NASA/GEWEX surface radiation budget release 3.0: 24.5-year dataset, GEWEX News, 21, 10–12, 2011. a
Sultan, B. and Janicot, S.: The West African Monsoon Dynamics. Part II: The “Preonset” and “Onset” of the Summer Monsoon, J. Climate, 16, 3407–3427, https://doi.org/10.1175/1520-0442(2003)016<3407:TWAMDP>2.0.CO;2, 2003. a
Sultan, B., Roudier, P., Quirion, P., Alhassane, A., Muller, B., Dingkuhn, M., Ciais, P., Guimberteau, M., Traore, S., and Baron, C.: Assessing climate change impacts on sorghum and millet yields in the Sudanian and Sahelian savannas of West Africa, Environ. Res. Lett., 8, 014040, https://doi.org/10.1088/1748-9326/8/1/014040, 2013. a
Taylor, K. E.: Summarizing multiple aspects of model performance in a single diagram, J. Geophys. Res.-Atmos., 106, 7183–7192, 2001. a
Taylor, K. E., Stouffer, R. J., and Meehl, G. A.: An Overview of CMIP5 and the Experiment Design, B. Am. Meteorol. Soc., 93, 485–498, https://doi.org/10.1175/BAMS-D-11-00094.1, 2012. a
Vautard, R., Noël, T., Li, L., Vrac, M., Martin, E., Dandin, P., Cattiaux, J., and Joussaume, S.: Climate variability and trends in downscaled high-resolution simulations and projections over Metropolitan France, Clim. Dynam., 41, 1419–1437, 2013. a
Vigaud, N., Vrac, M., and Caballero, Y.: Probabilistic downscaling of GCM scenarios over southern India, Int. J. Climatol., 33, 1248–1263, 2013. a
Vrac, M. and Friederichs, P.: Multivariate-intervariable, spatial, and temporal-bias correction, J. Climate, 28, 218–237, 2015. a, b, c
Vrac, M., Drobinski, P., Merlo, A., Herrmann, M., Lavaysse, C., Li, L., and Somot, S.: Dynamical and statistical downscaling of the French Mediterranean climate: uncertainty assessment, Nat. Hazards Earth Syst. Sci., 12, 2769–2784, https://doi.org/10.5194/nhess-12-2769-2012, 2012. a, b, c
Vrac, M., Noël, T., and Vautard, R.: Bias correction of precipitation through Singularity Stochastic Removal: Because occurrences matter, J. Geophys. Res.-Atmos., 121, 5237–5258, https://doi.org/10.1002/2015JD024511, 2016. a, b, c, d, e
Weedon, G. P., Gomes, S., Viterbo, P., Shuttleworth, W. J., Blyth, E., Österle, H., Adam, J., Bellouin, N., Boucher, O., and Best, M.: Creation of the WATCH forcing data and its use to assess global and regional reference crop evaporation over land during the twentieth century, J. Hydrometeorol., 12, 823–848, 2011. a, b
Weedon, G. P., Balsamo, G., Bellouin, N., Gomes, S., Best, M. J., and Viterbo, P.: The WFDEI meteorological forcing data set: WATCH Forcing Data methodology applied to ERA-Interim reanalysis data, Water Resour. Res., 50, 7505–7514, 2014. a, b