the Creative Commons Attribution 4.0 License.
the Creative Commons Attribution 4.0 License.
 | 30 Aug 2018
Varying soil moisture–atmosphere feedbacks explain divergent temperature extremes and precipitation projections in central Europe
Jakob Zscheischler
Sonia I. Seneviratne
The frequency and intensity of climate extremes is expected to increase in many regions due to anthropogenic climate change. In central Europe extreme temperatures are projected to change more strongly than global mean temperatures, and soil moisture–temperature feedbacks significantly contribute to this regional amplification. Because of their strong societal, ecological and economic impacts, robust projections of temperature extremes are needed. Unfortunately, in current model projections, temperature extremes in central Europe are prone to large uncertainties. In order to understand and potentially reduce the uncertainties of extreme temperature projections in Europe, we analyze global climate models from the CMIP5 (Coupled Model Intercomparison Project Phase 5) ensemble for the business-as-usual high-emission scenario (RCP8.5). We find a divergent behavior in long-term projections of summer precipitation until the end of the 21st century, resulting in a trimodal distribution of precipitation (wet, dry and very dry). All model groups show distinct characteristics for the summer latent heat flux, top soil moisture and temperatures on the hottest day of the year (TXx), whereas for net radiation and large-scale circulation no clear trimodal behavior is detectable. This suggests that different land–atmosphere coupling strengths may be able to explain the uncertainties in temperature extremes. Constraining the full model ensemble with observed present-day correlations between summer precipitation and TXx excludes most of the very dry and dry models. In particular, the very dry models tend to overestimate the negative coupling between precipitation and TXx, resulting in a warming that is too strong. This is particularly relevant for global warming levels above 2 ∘C. For the first time, this analysis allows for the substantial reduction of uncertainties in the projected changes of TXx in global climate models. Our results suggest that long-term temperature changes in TXx in central Europe are about 20 % lower than those projected by the multi-model median of the full ensemble. In addition, mean summer precipitation is found to be more likely to stay close to present-day levels. These results are highly relevant for improving estimates of regional climate-change impacts including heat stress, water supply and crop failure for central Europe.


The frequency and intensity of extreme temperature events is expected to increase due to anthropogenic climate change (Christidis et al., 2011; Rahmstorf and Coumou, 2011; Seneviratne et al., 2012; Otto et al., 2012; Morak et al., 2013; Fischer and Knutti, 2015). The occurrence and magnitude of temperature extremes strongly varies across regions and can have strong societal (e.g., Robine et al., 2008), ecological (Frank et al., 2015; Allen et al., 2010) and economic (Westerling et al., 2006; Barriopedro et al., 2011) impacts. Hence, reliable regional information for extreme temperatures and robust projections are urgently needed to develop mitigation and adaptation strategies.
At present, a much stronger increase in extreme temperatures compared to global mean temperature can be observed in many regions over land (Papalexiou et al., 2018), although this tendency is generally found to be smaller in observations compared to climate model simulations (Donat et al., 2017). Projections derived from simulations conducted with Earth system models (ESMs) show a further enhancement of this regional amplification (Seneviratne et al., 2016; Gudmundsson et al., 2017; Wartenburger et al., 2017). However, these projections are subject to large uncertainties, particularly in midlatitude regions such as central Europe (e.g., Seneviratne et al., 2012; Cheruy et al., 2014). The uncertainties in climate projections arise for different reasons and it is important to understand the underlying physical mechanisms in order to reduce uncertainties (Shepherd, 2014). In central Europe, anticyclonic weather conditions and soil moisture drying have been identified as important drivers for the development of heat waves (Quesada et al., 2012). Over longer timescales, summer soil moisture strongly contributes to the regional amplification of extreme temperatures in climate change projections in Europe (Seneviratne et al., 2013; Vogel et al., 2017).
Soil moisture plays an essential role because it influences the partitioning of the energy available at the land surface into the sensible and the latent heat fluxes, depending on the prevailing climate regime (Koster et al., 2004; Seneviratne et al., 2010). In a transitional climate regime, evapotranspiration depends on soil moisture, which affects the surface energy fluxes and, consequently, temperature. This mechanism can result in a soil moisture–temperature feedback, whereby increased temperatures (e.g., due to global warming) lead to a higher atmospheric moisture demand, which can then induce soil drying and further enhance the initial temperature increase (Seneviratne et al., 2010). In addition, changes in evapotranspiration may influence precipitation via moisture input to the atmosphere, while precipitation itself also affects soil moisture (Koster et al., 2004; Seneviratne et al., 2013; Guillod et al., 2015). Currently, central Europe is typically characterized by a wet climate regime (no soil moisture limitation) (Seneviratne et al., 2006, 2010; Teuling et al., 2009) but it can occasionally shift to a transitional regime, in particular in summer during droughts (Zscheischler et al., 2015). An example of such a regime shift was the summer of 2003, during which soils were so dry that the occurring heat wave was substantially enhanced by the lack of soil moisture (Fischer et al., 2007; Whan et al., 2015). In addition, climate projections suggest a long-term shift to the transitional climate regimes under a warmer climate, whereby soil moisture would increasingly affect summer temperature variability (Seneviratne et al., 2006, 2013; Vogel et al., 2017).
Hence, diagnosing uncertainties in soil moisture–atmosphere coupling may help to better understand uncertainties in projections of temperature extremes. Model uncertainties in the simulation of soil moisture and temperature can arise if the transition between wet and transitional regimes is not well captured (Seneviratne et al., 2006; Boe and Terray, 2008). Furthermore, varying trends in soil moisture (Lorenz et al., 2016) and systematic biases in the representation of soil moisture–temperature feedbacks can contribute to these uncertainties (Cheruy et al., 2014; Mueller and Seneviratne, 2014; Sippel et al., 2017).
Precipitation strongly influences projected changes in soil moisture. Unfortunately changes in regional precipitation are among the most uncertain in climate change projections (Greve et al., 2018). Particularly in central Europe, models do not agree on the sign of change (Orth et al., 2016) and correspondingly, projected changes in soil moisture are also highly uncertain (Orlowsky and Seneviratne, 2013). While there is evidence that anthropogenic climate change contributes to increasing trends in northern Europe and decreasing trends in the Mediterranean region, no trends are apparent in central Europe, and reconciling observations and models remains challenging (Zhang et al., 2007; Gudmundsson and Seneviratne, 2016; Orth et al., 2016; Gudmundsson et al., 2017).
One approach to overcome these challenges and reduce uncertainties in projected changes with regard to underlying processes is the use of physically consistent observational constraints. Such constraints can be applied on multi-model ensembles and allow for the selection of the “best” models with respect to a physically plausible metric rather than changing model code. Constraining a multi-model ensemble assumes that models which are in better agreement with a metric from the present-day observed climate have a more realistic representation of relevant processes and subsequently produce more reliable future projections.
However, previous studies that have applied observational constraints to projected changes in hot extremes in central Europe come to contrasting conclusions. Christensen and Boberg (2012) performed an analysis using the global multi-model ensemble simulations collected in CMIP5 (Coupled Model Intercomparison Project Phase 5) (Taylor et al., 2012). They show that models tend to have a warm season bias in regions where land–atmosphere feedbacks are important such as central Europe (Christensen and Boberg, 2012). Borodina et al. (2017) suggested that uncertainties in projections of the hottest day of the year (TXx) are linked to present-day climatology and concluded that the frequency of hot extremes are likely to increase at a higher rate than the multi-model estimate for large parts of the Northern Hemisphere based on a TXx scaling constraint (assuming constant TXx increase with summer mean temperature increase). However, they did not find a robust signal for central Europe. Sippel et al. (2017) applied a land-surface coupling metric (Zscheischler et al., 2015) to CMIP5. Their results suggest that temperature extremes in central Europe are likely to be lower than predicted by the multi-model mean, but the constraint applied had little effect on the change in temperature extremes in a warmer climate (Sippel et al., 2017). Hence, the question regarding the extent to which temperature extremes in central Europe are projected to increase under enhanced greenhouse forcing and whether these projections can be substantially constrained with observations still remains to be answered.
In this study we investigate projected changes over summer in central Europe in the CMIP5 ensemble in order to better understand the large uncertainties in the projected changes of TXx. We investigate underlying mechanisms in ESMs which are relevant for changes in temperature extremes. In the first part of the study we identify dominant processes in the models which can explain uncertainties in TXx projections. We focus on the role of land–atmosphere interactions by investigating the relationship between the land surface and atmospheric variables during summer, in particular precipitation, latent heat flux, soil moisture and TXx. The analysis further motivates the usage of a process-based constraint that quantifies the strength of land–atmosphere coupling. To this end, we use the correlation between summer precipitation and TXx. Applying this constraint allows us to substantially reduce the uncertainties associated with projections in summer precipitation and temperature extremes in central Europe.
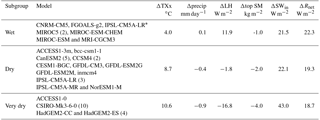
Table 1Classification of CMIP5 models into three subgroups. Changes of the multi-model median of TXx, precipitation (precip), latent heat flux (LH), top soil moisture (top SM), incoming shortwave radiation (SWin) and net radiation (Rnet) are shown between the periods from 2081 to 2100 and from 1950 to 1969. The number in brackets corresponds to the number of ensemble members. If not indicated then only one ensemble member is used.
∗ r4i1p1.
2.1 CMIP5
We investigated 23 state-of-the-art climate models with up to 10 ensemble members (Table 1) from the CMIP5 archive (Taylor et al., 2012) for the historical period and the high-emissions scenario “RCP8.5” (Meinshausen et al., 2011). The RCP8.5 scenario exhibits the strongest warming signal at the end of the 21st century and has a high signal-to-noise ratio to detect robust changes. We used all of the models and ensemble members that were available for our considered variables (see below), resulting in a total of 44 model realizations.
We analyzed changes over land in precipitation, latent heat flux, top soil moisture, radiation and TXx. We calculated TXx from daily maximum temperature data at each grid box and for each model. The resulting TXx values occur on different days at different locations in different models. From the resulting TXx fields we computed area-weighted averages across the SREX region Central Europe (CEU, see inset in Fig. 1). For all other variables we calculated summer means and averaged across CEU.
For each variable we studied changes between 1950 and 2100. As our focus was on long-term trends, we calculated 20-year means to remove interannual variability. The years indicated for the time series in the plots are the center of the 20 years (year 11). Changes are calculated as differences from the base period (1950–1969). This allowed for the exclusion of model bias and the direct comparison of long-term trends in model runs. For the distributions at the end of the 21st century (see figures) we compared the means of 2081–2100 with the 1950–1969 base period.
We also present changes over time relative to changes in global mean temperature, following the near-linear relationship between cumulative CO2 emissions and global mean temperatures (IPCC, 2013). We estimated global mean temperature (Tglob) as the average of all 44 models. We then calculated 20-year means and computed changes from 1951 to 2100 with respect to the base period from 1950 to 1969. To account for changes with respect to preindustrial levels we added the multi-model mean increase from the 44 models of the CMIP5 ensemble from 1871 to 1890 to the period from 1950 to 1969 to the changes (0.23 ∘C).
2.2 GLACE-CMIP5
We made use of the output from five ESMs that contributed to the GLACE-CMIP5 experiment (Seneviratne et al., 2013) to understand the role of soil moisture–temperature feedbacks in climate-change projections. We analyzed two experiments, the CMIP5-like reference simulation (hereafter referred to as GLACE CTL) and the simulations with prescribed 20th century soil moisture conditions to suppress the impact of soil moisture–climate feedbacks in the projections (SM20c in Vogel et al., 2017, hereafter referred to as GLACE SM20c). The GLACE SM20c experiment removes the projected long-term drying of soil moisture as well as the short-term soil moisture variability. Thus, when comparing GLACE SM20C and GLACE CTL, differences in climate are due to the removed soil moisture trend and the removed short-term soil moisture–climate interactions. All simulations cover the time period from 1951 to 2100 using historical forcing until 2005 and forcing from the RCP8.5 scenario from 2006 to 2100 (Meinshausen et al., 2011). Since GLACE-CMIP5 simulations are only available from 1951 (not 1950) we adjusted the base period to 1951–1970 when considering the GLACE-CMIP5 experiments.
2.3 Observations
We used gridded data for TXx and summer precipitation from E-OBS (version 15, Haylock et al., 2008), CRU version 4.1 (Harris et al., 2014), GPCC version 7 (Schneider et al., 2014, only precipitation) and HadEX (Hadley Centre Global Climate Extremes Index 2, only TXx) from Donat et al. (2013), which are derived from station observations. Furthermore we used Princeton forcing data (Sheffield et al., 2006) and GWSP3 (the third Global Soil Wetness Project updated from Dirmeyer et al., 2006), a global meteorological forcing dataset used as forcing for the CMIP6 experiments. Note that both forcing datasets (Princeton and GSWP3) are bias corrected with gridded observations, whereas Princeton uses CRU precipitation and GSWP3 uses GPCC precipitation. All data are available for the reference time period from 1961 to 1990 (which was established in the IPCC AR5) and were area-weighted averaged over CEU to compare with model output.
3.1 Projected increase in TXx and divergent changes in summer precipitation

Figure 1Change in (a) TXx and (b) summer precipitation (precip) in Central Europe (CEU, defined in the inset of panel a) for 44 model realizations for wet (blue), dry (orange), and very dry (dark red) models and the multi-model median (dashed). Changes are calculated as 20-year running means with respect to the base period 1950–1969. Density distributions are shown for changes in the 2081–2100 period with respect to the base period (right). The horizontal lines in the density distributions indicate the multi-model median of the wet (blue), dry (orange), and very dry (dark red) ensembles and the multi-model median (dashed) for changes in the 2081–2100 period.
TXx increases for all 44 model realizations in CEU by the end of the 21st century (Fig. 1a). The multi-model median increases by around 9.5 ∘C by the end of 21st century (Table 1) with values ranging from 3 to 13 ∘C, which is in agreement with results from various other studies (e.g., Seneviratne et al., 2012; Vogel et al., 2017). At the end of the 20th century, the multi-model median of precipitation shows no clear trend and changes of the individual models differ between −0.3 and 0.2 mm day−1 (Fig. 1b). At the beginning of the 21th century, model differences increase and model runs start diverging with respect to precipitation changes. As the majority of the models show a decrease in precipitation at the end of the 21st century, the multi-model median decreases to −0.44 mm day−1 (−23 %). Kernel density estimates suggest a trimodal distribution of summer precipitation changes at the end of the 21st century (Fig. 1b). We use these density estimates to classify the model runs by selecting the two local minima of the trimodal distribution as the boundaries for the three groups. Table 1 shows which model run was assigned to which group. Ten models are in the first mode, which is mostly associated with positive changes of summer precipitation, and are referred to as “wet” hereafter (blue in Fig. 1). Eighteen models are in the middle range of the precipitation distribution, which is associated with a slight drying in CEU at the end of the 21st century, and are referred to as “dry” (orange in Fig. 1). Sixteen models are in the lower tail of the distribution, which is associated with a strong decrease in precipitation up to more than 1 mm day−1, and are referred to as “very dry” models (red in Fig. 1). The multi-model median for projected changes at the end of the 21st century between these three groups differs strongly from 0.13 mm day−1 (6 %) for the wet ensemble, to −0.36 mm day−1 (−19 %) for the dry ensemble and a decrease of −0.90 mm day−1 (−44 %) for the very dry ensemble. The median of the whole ensemble is within the dry ensemble (Table 1).
Applying the classification to TXx, we find that the hottest models tend to be very dry whereas dry and wet models show less of an increase in TXx, even though the distribution of TXx does not show a clear trimodal behavior (with the dry and wet models partly overlapping). The medians of TXx of the wet, dry and very dry ensembles are 10.6, 8.7 and 6.5 ∘C, respectively (Table 1), implying a difference between the median of the wet and very dry models at the end of the 21st century of more than 4 ∘C (Fig. 1a).
The clustering of the three model groups according to the precipitation trends being partly reflected in the ensemble of the TXx trends (at least for the very dry vs. dry and wet models) suggests a critical role of land–atmosphere interactions. Precipitation can be seen as a proxy for dryness: a decrease in precipitation decreases soil moisture, influencing the partitioning of surface heat fluxes, which in turn impacts the air temperature. The change in precipitation may be driven by large-scale circulation and local processes such as soil moisture–precipitation feedbacks and convection. To examine these relationships in more detail, we investigate other summer variables in the following section.
3.2 The role of changes in summer land and atmosphere variables
We analyze changes in the latent heat flux, incoming shortwave radiation, net radiation, convective and stratiform precipitation, and top soil moisture rather than total soil moisture as we only expect a strong exchange with the atmosphere in the upper layers of the soil (Cheng et al., 2016). All models show a decrease in top soil moisture, with a clear clustering following the three identified model subgroups (Fig. 2). Wet models only show a slight decrease of around 1 kg m−2, whereas very dry models show a strong soil moisture decrease of 4 kg m−2, with ACCESS1-0 exhibiting the strongest decrease (Table 1). Summer latent heat flux clusters, similarly to precipitation, follow a trimodal distribution at the end of the 21st century. We note that the divergence of the three subgroups starts at a similar time as for precipitation. Wet models show a continuous increase of latent heat flux, dry models show an overall slight decrease of latent heat flux and very dry models show a strong decrease of latent heat flux until 2100 (Fig. 2b). All models show an increase in the incoming shortwave radiation in summer. We find the strongest increases for the very dry models. However, the dry and wet models do not show a distinguishable behavior: the medians for these two groups are similar and the distributions overlap strongly (Fig. 2c). No detection of three groups is possible for net radiation (Fig. 2d). Two of the wet models (MRI-CGCM3, MIROC-ESM) show the strongest increase of net radiation, even though their TXx increase is rather small. Hence medians of the three model subgroups are very similar at the end of the 21st century. (Note that “incm4” does not show an increase in summer incoming shortwave radiation over CEU.)
To understand the causes for the precipitation decrease, we analyze convective and stratiform precipitation separately. We exclude CCSM4 due to artifacts in the partitioning of precipitation. The evolution of convective precipitation is very similar to that of total precipitation and again we find wet, dry and very dry models (Fig. 2e). In contrast, the stratiform summer precipitation decreases slightly overall until 2100 and the three model subgroups are not distinguishable (Fig. 2f). We also considered changes in the geopotential height (500 hPa) and could not find systematic behaviors in the models (not shown).
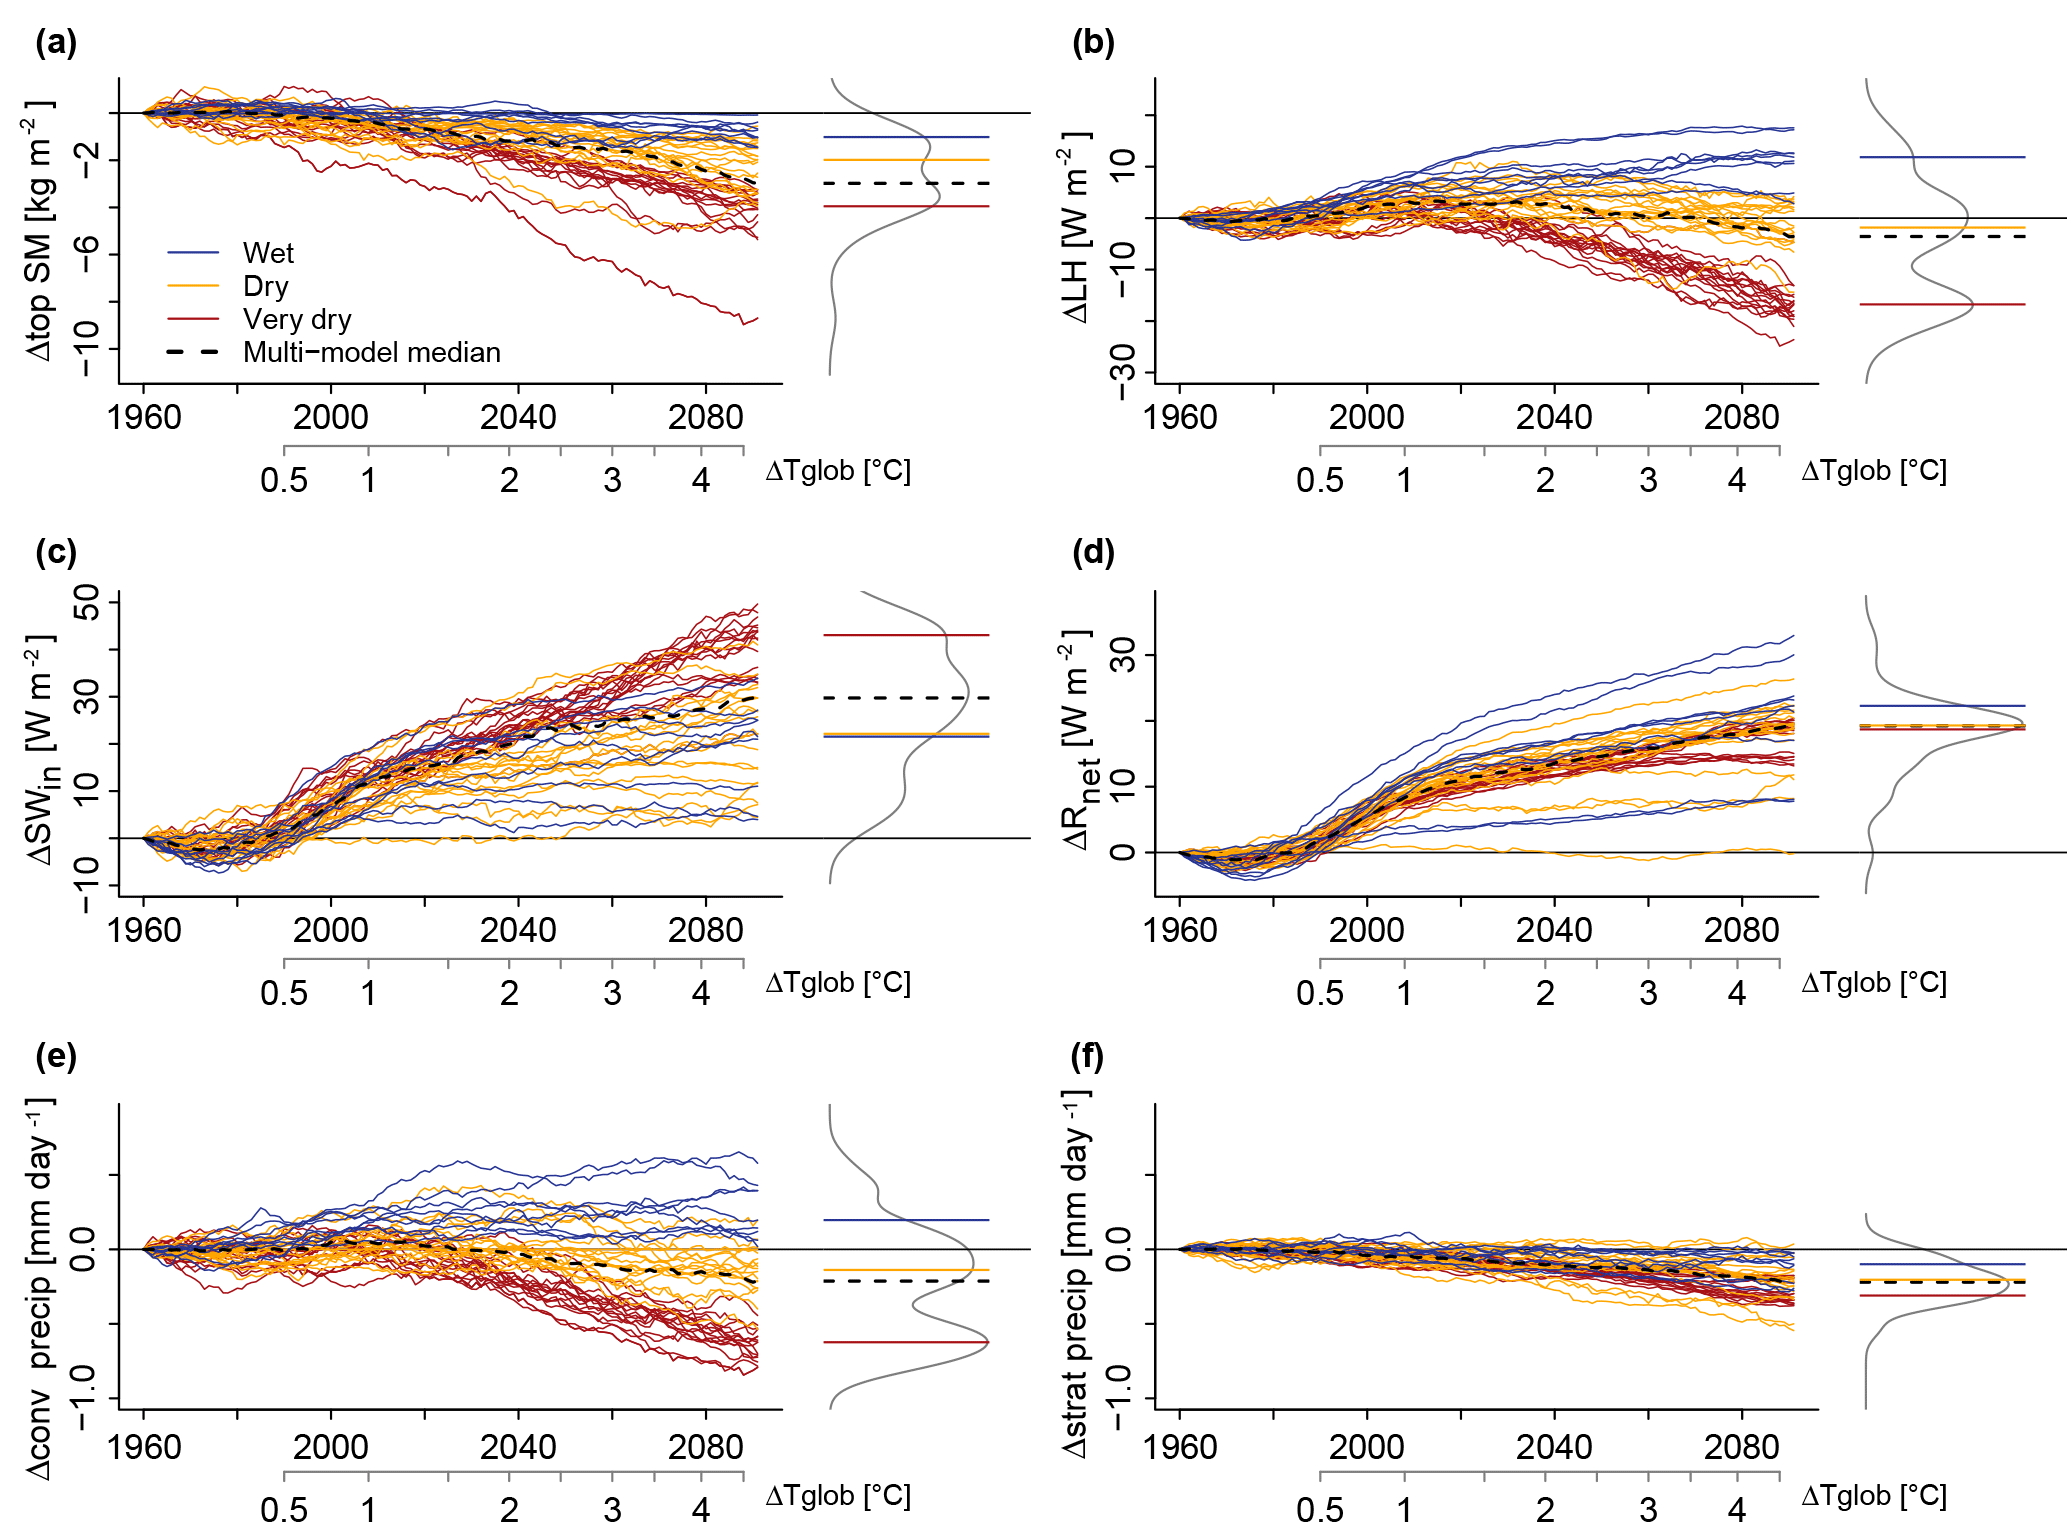
Figure 2Change in summer (a) top soil moisture (top SM), (b) latent heat flux (LH), (c) incoming shortwave radiation (SWin), (d) net radiation (Rnet), (e) convective precipitation (conv precip) and (f) stratiform precipitation (strat precip) in CEU for wet (blue), dry (orange) and very dry models (red), and the multi-model median (dashed). Changes are calculated as 20-year running means with respect to the base period (1950–1969). Density distributions are shown for changes between the period from 2081 to 2100 and the base period.
Overall these time series allow us to identify two phases: (i) “Until the beginning of the 21st century”, which is represented by an increase in net radiation associated with increases in latent heat flux and TXx rather independently of any changes in soil moisture and precipitation. (ii) “Afterwards”, which is represented by an evolution of the divergent behavior for precipitation resulting in a trimodal distribution. The changes of the variables for the three model subgroups are summarized in Table 1. The three groups can be characterized as follows:
-
“Wet” models tend to show a further increase in net radiation with only a little decrease in soil moisture, associated with an increase in precipitation, an increase in latent heat flux and a less strong increase of TXx (of around 6 ∘C for the median of the wet models).
-
“Dry” models show a less strong increase in net radiation, a decrease in the soil moisture associated with a reduction in precipitation and latent heat flux and a strong increase in TXx (of more than 8 ∘C for the median of the dry ensemble).
-
“Very dry” models display a similar increase in net radiation to the dry models but a stronger decrease in soil moisture associated with a stronger decrease in precipitation, latent heat flux and the strongest increase of TXx (more than 10 ∘C for the multi-model median). The very dry models are characterized by a strong link between precipitation, latent heat flux and TXx, although net radiation might not be the only driver for the strong increase in TXx. In the wet models, a net radiation increase might increase the latent heat flux, which may, in turn, increase precipitation. This process might decrease top soil moisture slightly and subsequently lead to a less strong increase in TXx.
3.3 Soil moisture as a possible driver for divergent summer precipitation in models

Figure 3Change in (a) TXx and (b) summer precipitation (precip) in CEU with respect to the base period (1951–1970). Changes are computed based on 20-year moving averages with respect to the base period. The shaded area shows the minimum and maximum from the wet (blue), dry (orange) and very dry (red) models. Changes for GLACE CTL (pink) and GLACE SM20c (violet) are also shown. Dashed lines represent the multi-model median of the full ensemble (black) and GLACE CTL (pink).
The previously presented results suggest the strong contribution of land–atmosphere interactions to projected changes in TXx. However, from the time series we can only hypothesize regarding the underlying mechanisms. Therefore, for a more in-depth understanding of the role of soil moisture as a possible driver for precipitation divergence we analyze GLACE-CMIP5 model simulations (Seneviratne et al., 2013). In GLACE SM20c, the soil moisture–climate feedbacks are switched off and there is typically more water available in the model simulations due to the fact that soils are not drying in comparison to GLACE CTL. For both TXx and precipitation, the GLACE CTL runs are within the range of the full CMIP5 ensemble. For precipitation in particular the median of GLACE CTL and the multi-model median of CMIP5 are equal, showing a decrease to −0.4 mm day−1 at the end of the 21st century (Fig. 3b). The warming in GLACE CTL is around 1.8 ∘C weaker at the end of the 21st century than in the full CMIP5 ensemble (7.8 ∘C vs. 9.6 ∘C). The GLACE CTL and GLACE SM20C simulations show strong differences in the projected increase of TXx and precipitation. The GLACE SM20c simulations are associated with less strong warming and only show an increase in TXx of 4.9 ∘C at the end of the 21st century. All but one of the GLACE SM20C simulations show an increase in summer precipitation (Fig. 3a) resulting in 0.1 mm day−1 at the end of the 21st century in contrast to −0.4 mm day−1 for GLACE CTL and the full ensemble. Hence, for GLACE SM20c changes in summer precipitation are shifted towards wet conditions. This suggests that soil moisture–precipitation feedbacks strongly contribute to the drying precipitation signal found in the dry and very dry models.
3.4 Constraining: determining which projection pathways are more realistic
After assessing relevant relationships and processes in the three identified model groups, we investigate whether a wet, dry or very dry pathway is more likely in the future; therefore, we compare our results to observations. We focus on precipitation and TXx, as we identified a link between these variables in the models, and also because well constrained gridded observations are available for CEU. We show changes in precipitation and TXx for five different datasets described in Sect. 2.3. For the length of the observational time period, trends in TXx and precipitation are within the range of the model estimates (see Fig. 4). We find a very similar evolution of TXx between HadEX and EOBS as well as between CRU, GSWP3 and Princeton, which is probably partly related to the fact that they share the same underlying data. Overall, the datasets show a decrease in TXx from 1960 onward and an increase only after 1980. This evolution might be the result of aerosol effects and global dimming and brightening (Wild et al., 2005; Sanchez-Lorenzo et al., 2015).
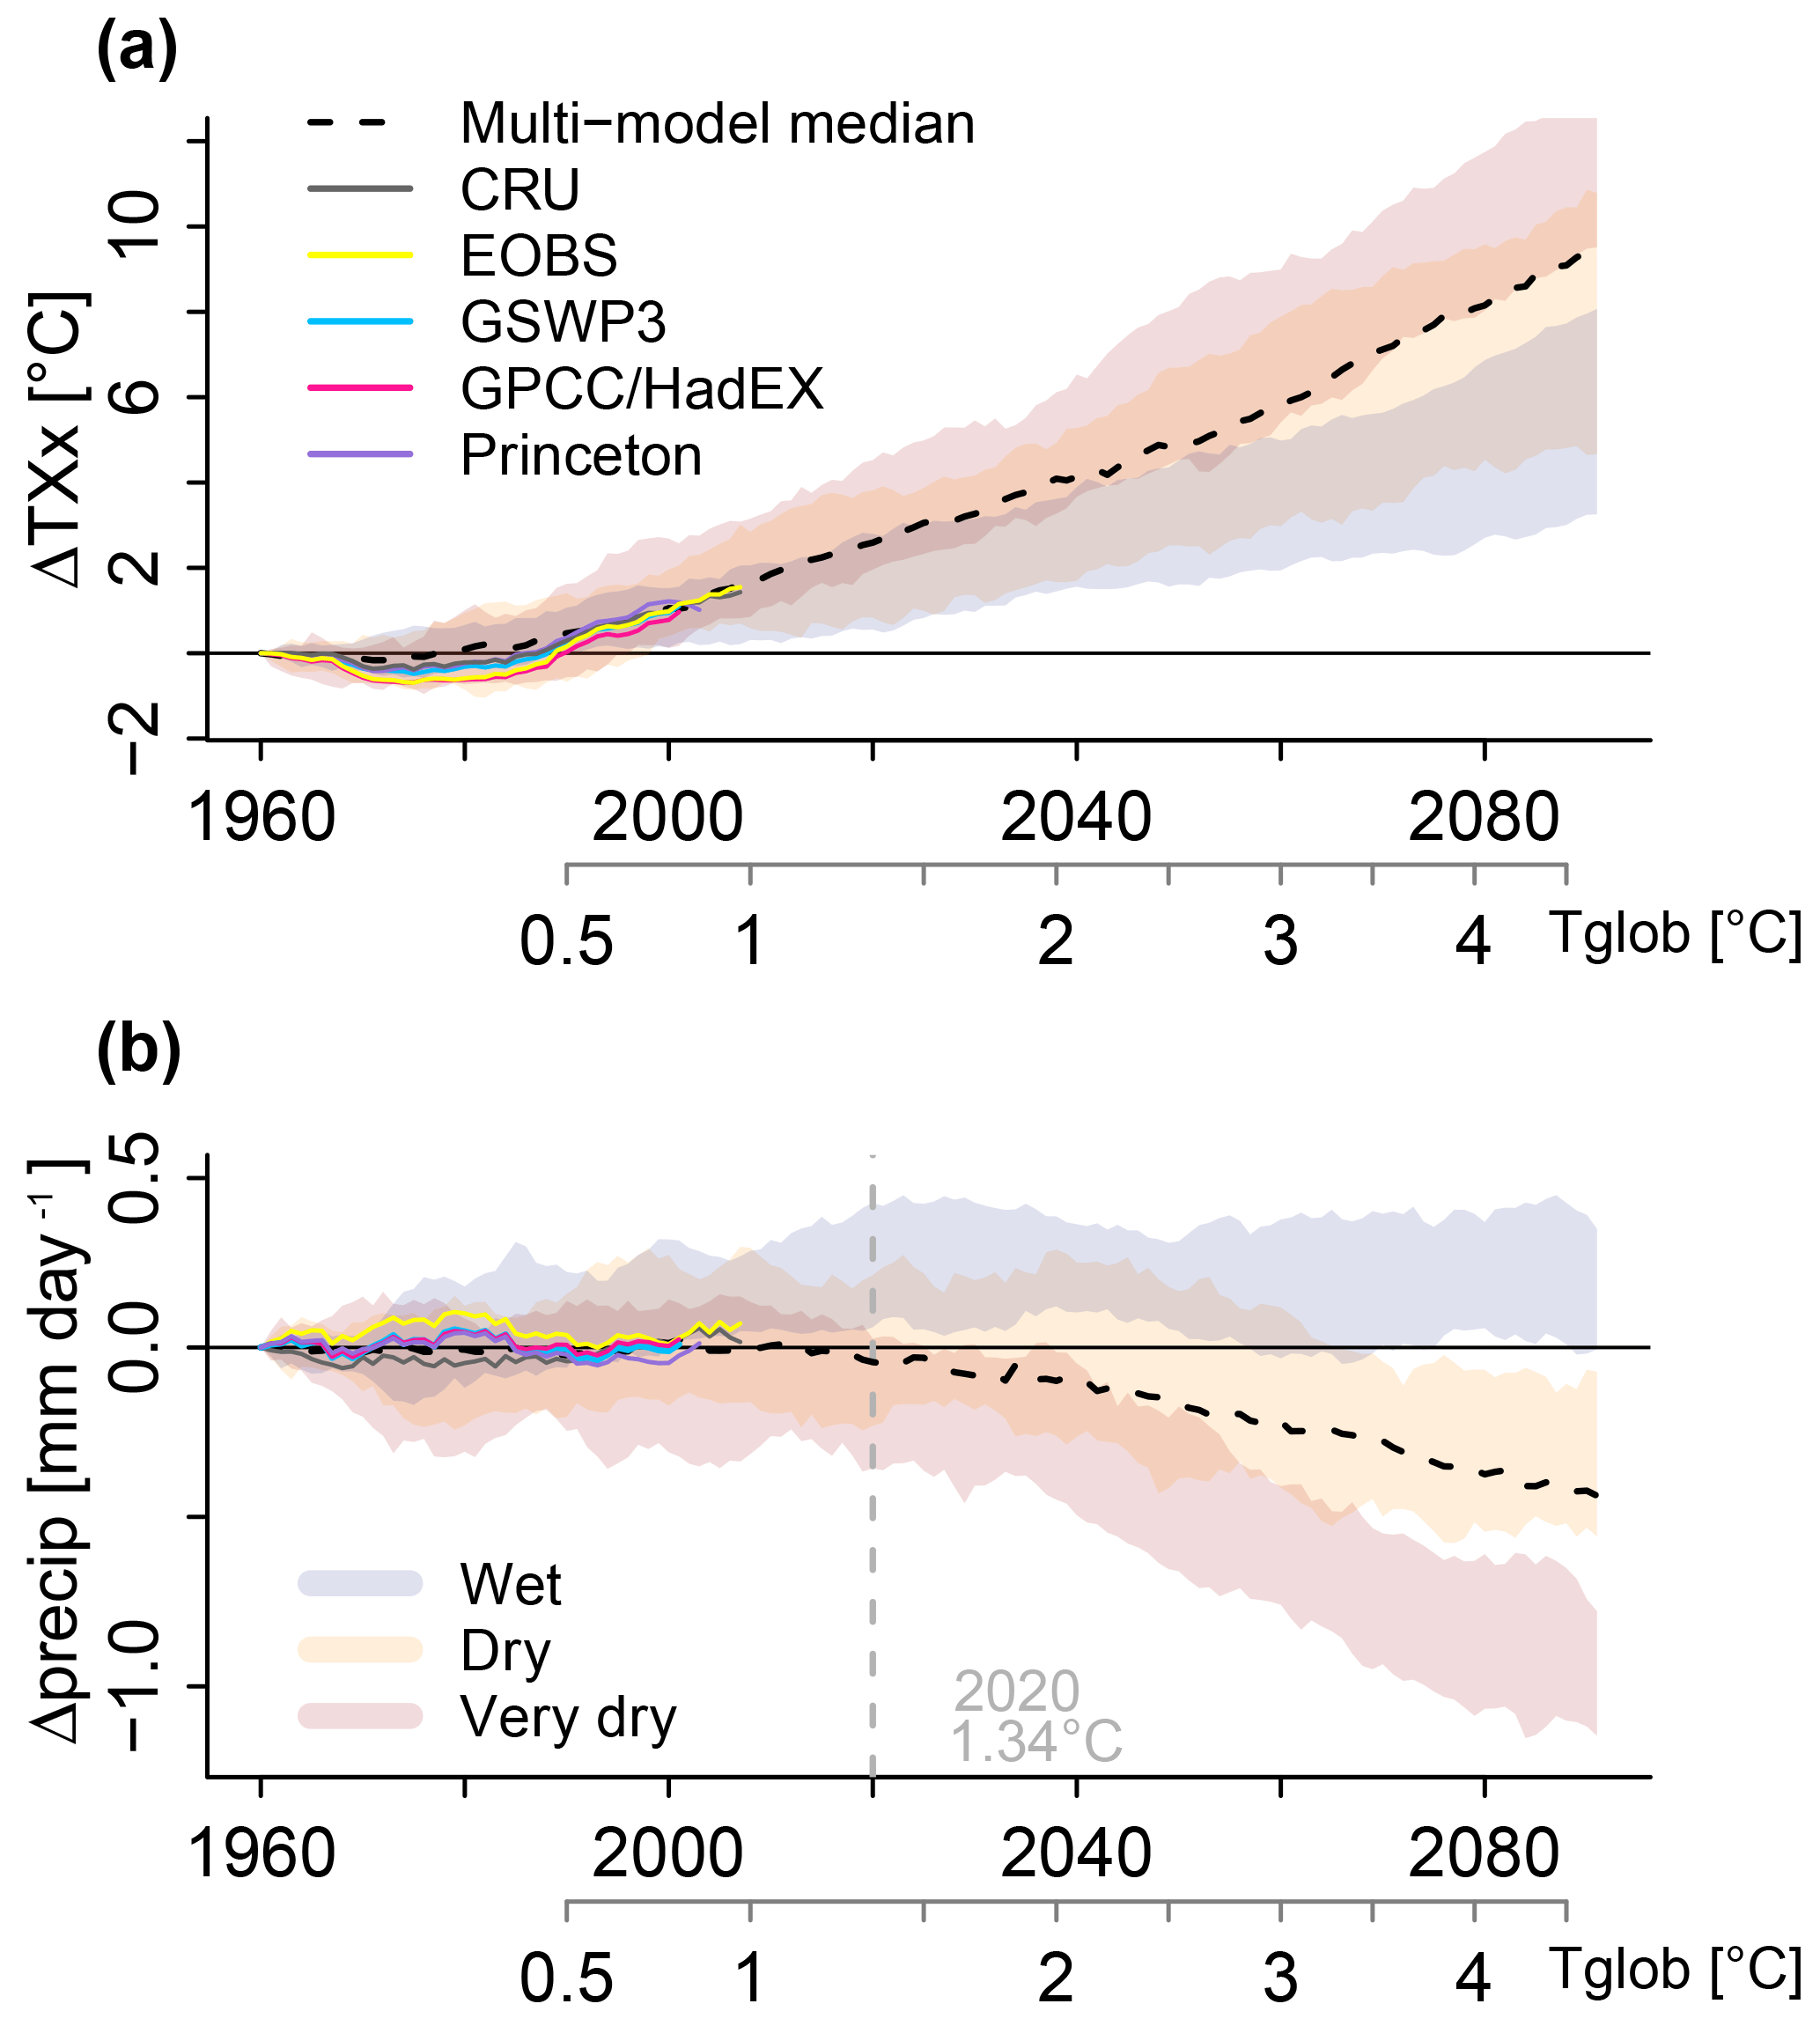
Figure 4Changes in (a) TXx and (b) summer precipitation (precip) in CEU. The multi-model mean median (dashed black) of the whole ensemble is shown. The shaded area shows the minimum and maximum from the wet (blue), dry (orange) and very dry (red) models. The gray lines show changes of CRU, EOBS, GSWP3, GPCC/HadEX and Princeton (20-year means) from 1950 to 1969 until the end of the observed time periods which ranges from 2010 to 2016. The gray vertical line indicate from where the distributions of precipitation for the very dry and wet models do not overlap.
Figure 5(a) Future vs. present-day cor(TXx, precip) for wet (blue), dry (orange), very dry models (red) and for observations. The one-to-one line is shown in black. The gray background depicts the minimum and maximum from the distribution of cor(TXx, precip) of the observational datasets. (b) The projected increase in TXx vs. present-day cor(TXx, precip). The stars indicate the models within the constrained ensemble, the colors refer to the three model subgroups as in (a).
Summer precipitation shows a stronger variability. CRU generally shows a slight decrease whereas the other datasets slightly increase in the 1970s and decrease after 1980. This could again be related to effects of global dimming and brightening. Until 1990 GPCC, GSWP3 and Princeton show very similar changes in precipitation. Most of the CMIP5 models do not show the dimming and brightening evolution of precipitation and TXx. However, after 1990 observed TXx and precipitation are close to the multi-model median. We conclude that considering univariate time series will not help to reduce uncertainty.

Figure 6Changes in (a) TXx, (b) summer precipitation (precip), (c) top soil moisture (top SM) and (d) latent heat flux (LH) in CEU. Changes depicted as 20-year moving averages relative to the base period (1950–1969). The shaded areas cover the minimum and maximum from the wet (blue), dry (orange) and very dry (red) models, respectively. The black lines show the changes of individual model runs of the constrained ensemble. Density distributions are shown for changes during 2081–2100 for the whole (grey) and the constrained (green) ensemble (right).
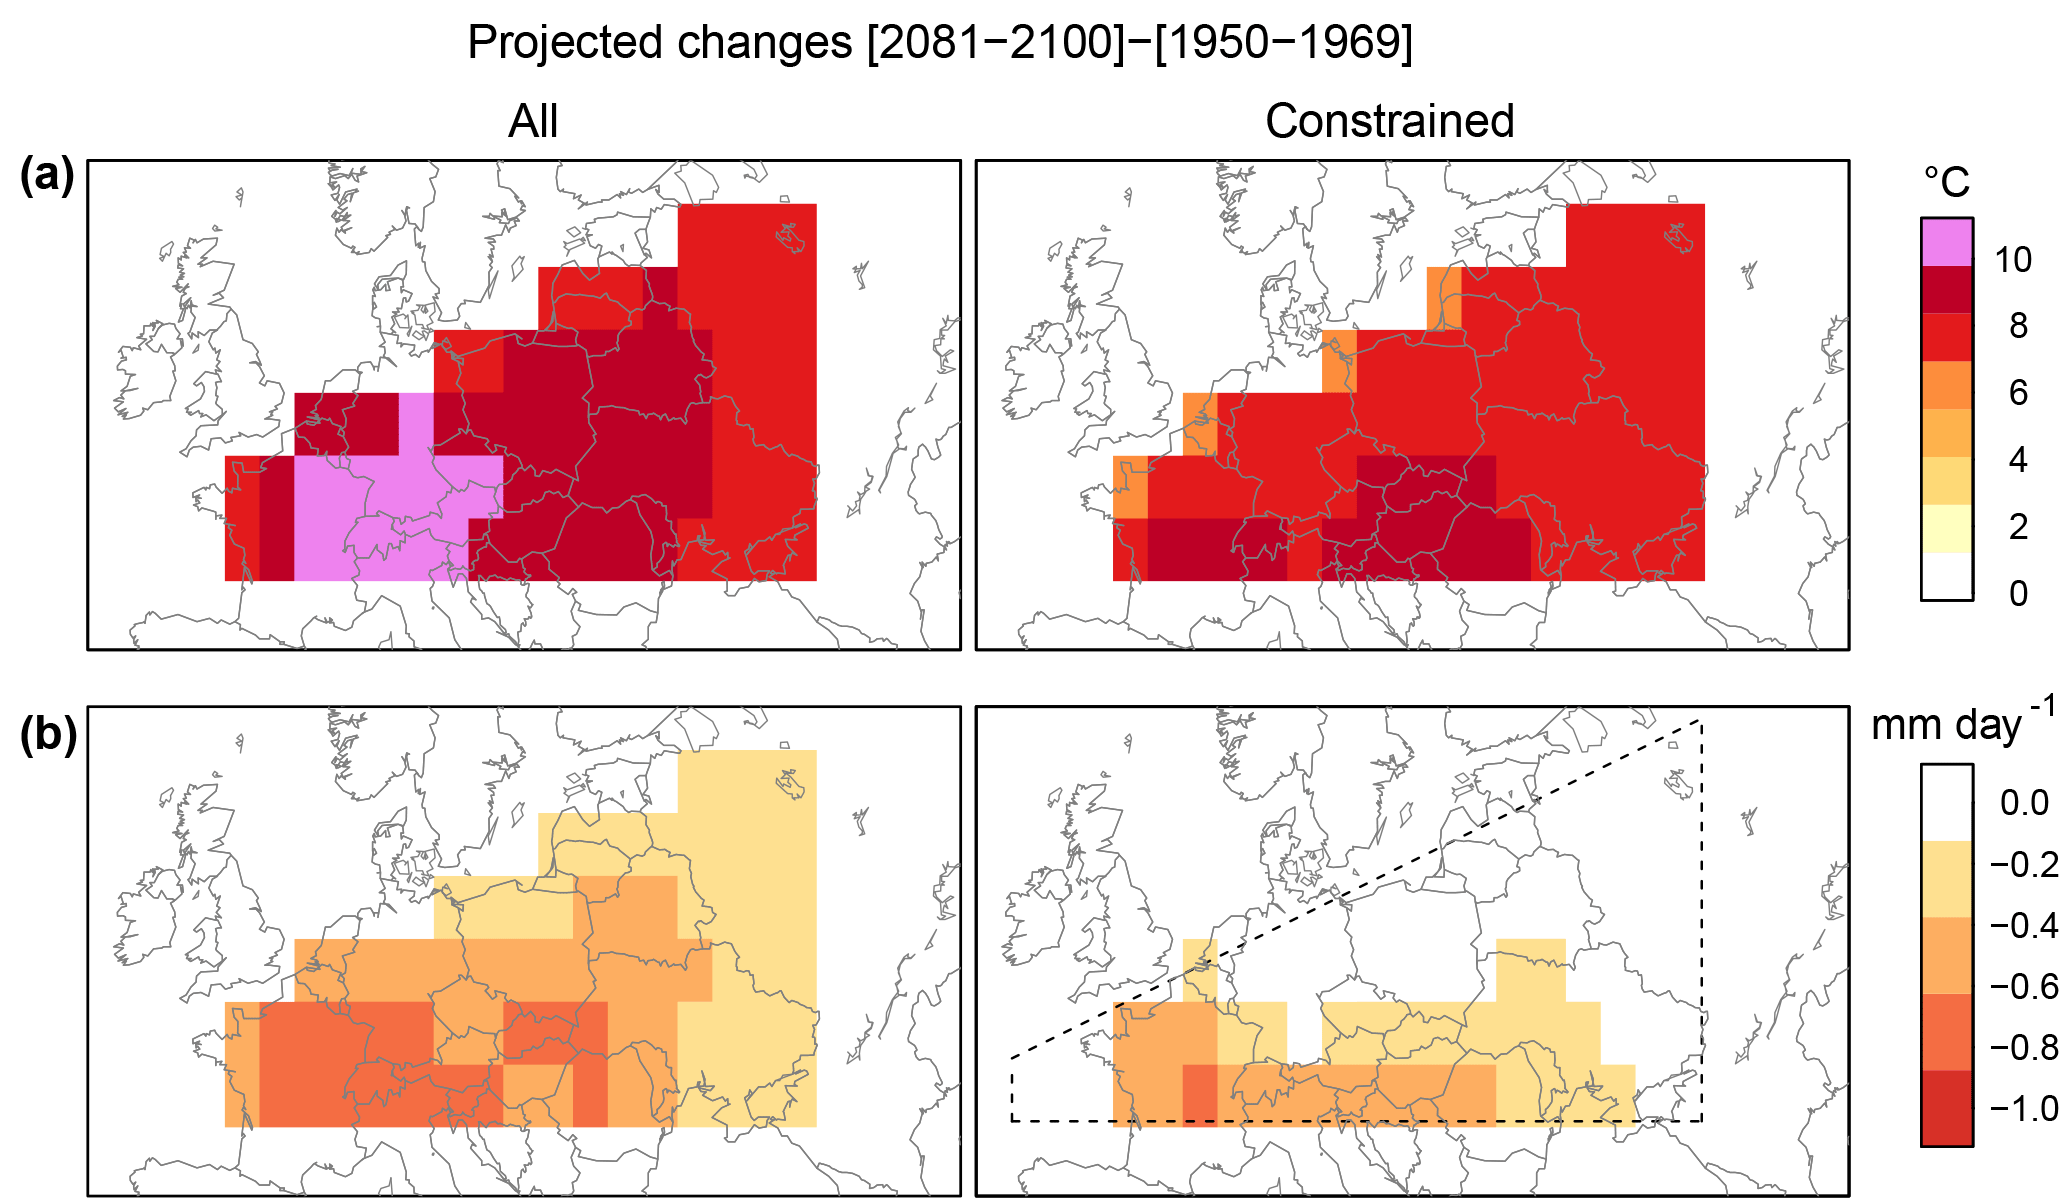
Figure 7Future vs. present-day (a) TXx and (b) summer precipitation of the multi-model mean from the full (left) and the constrained (right) ensemble.
Suspecting a coupling between precipitation and TXx, we compute the spatially averaged correlation of precipitation and TXx (cor(TXx, precip)) for the present (1961–1990) and the future (2071–2100). Such a correlation-based metric is commonly used to diagnose land–atmosphere coupling (Seneviratne et al., 2006; Lorenz et al., 2012; Miralles et al., 2012). The correlation cor(TXx, precip) is always negative and varies largely across models (between −0.64 and −0.19 for present-day) but seems to be a model feature that is fairly consistent through time, resulting in a correlation of R=0.74 (p<0.001) between the present-day and end-of-century (cor(TXx, precip)) across models (Fig. 5). We determine the observed range by the minimum and maximum values from the total of five correlations based on observational products described in Sect. 2.3. The observations cover a rather small range (between −0.45 and −0.28), which corresponds to the medium to upper range of the models (Fig. 5). Most of the very dry and dry model runs can be excluded from the multi-model ensemble. The constrained model ensemble includes 13 models, mainly from the wet and dry ensemble (Fig. 5). The projected distributions for TXx and precipitation show a substantial reduction in model spread (Fig. 6a). The spatial pattern show a strong reduction in TXx and an increase in precipitation compared to the full ensemble (Fig. 7). Interestingly, the multi-model median of the constrained ensemble hardly shows a change in precipitation (−0.17 mm day−1 compared with −0.43 mm day−1 for the full ensemble, Fig. 6b). For large parts of CEU no change in the precipitation trend is detected (Fig. 7). Particularly the dry and the hot tails of the projected distributions are removed, resulting in a reduction in TXx of around 2 ∘C (from 9.5 to 7.5 ∘C) which corresponds to a reduction of 20 %. The constrained ensemble indicates less strong drying since models with a very strong decrease in top soil moisture and latent heat flux are removed (Fig. 6c, d). Soil moisture is only projected to decrease by 1.45 kg m−2 which reduces the projected drying for the full ensemble by 50 %. The constrained multi-model median of the latent heat flux changes sign, projecting an increase of 2.8 W m−2 in contrast to a decrease of −3.6 W m−2 for the full ensemble. Uncertainties of the projections are slightly reduced due to the less likely dry tails of the distribution (Fig. 6). These results suggest that observationally constrained long-term changes in summer TXx in CEU are within the lower range of the multi-model ensemble and are only associated with a small decrease in summer precipitation.
Furthermore, we find that the distributions of the full and constrained ensemble are still very similar for global warming levels of 1.5 and 2 ∘C, but show strong differences for 3 and 4 ∘C (Fig. 8). This indicates that the model uncertainties only play a major role at high warming levels. Applying a scaling of TXx and precipitation with Tglob, following Seneviratne et al. (2016), we find a reduction for TXx of 1 ∘C and for precipitation of 0.3 mm day−1 for the constrained compared to the full ensemble for global warming of 4.5 ∘C. This corresponds to a reduction of the TXx increase from 1.8 to 1.6 ∘C per ∘C Tglob (Fig. A2 in the Appendix). For top soil moisture and latent heat flux the interquartile range of the constrained ensemble is shifted towards wetter conditions for 3 and 4 ∘C Tglob increase (Fig. A1). Overall very dry and hot projections are excluded for global mean temperature increase above 2 ∘C (Fig. A1).
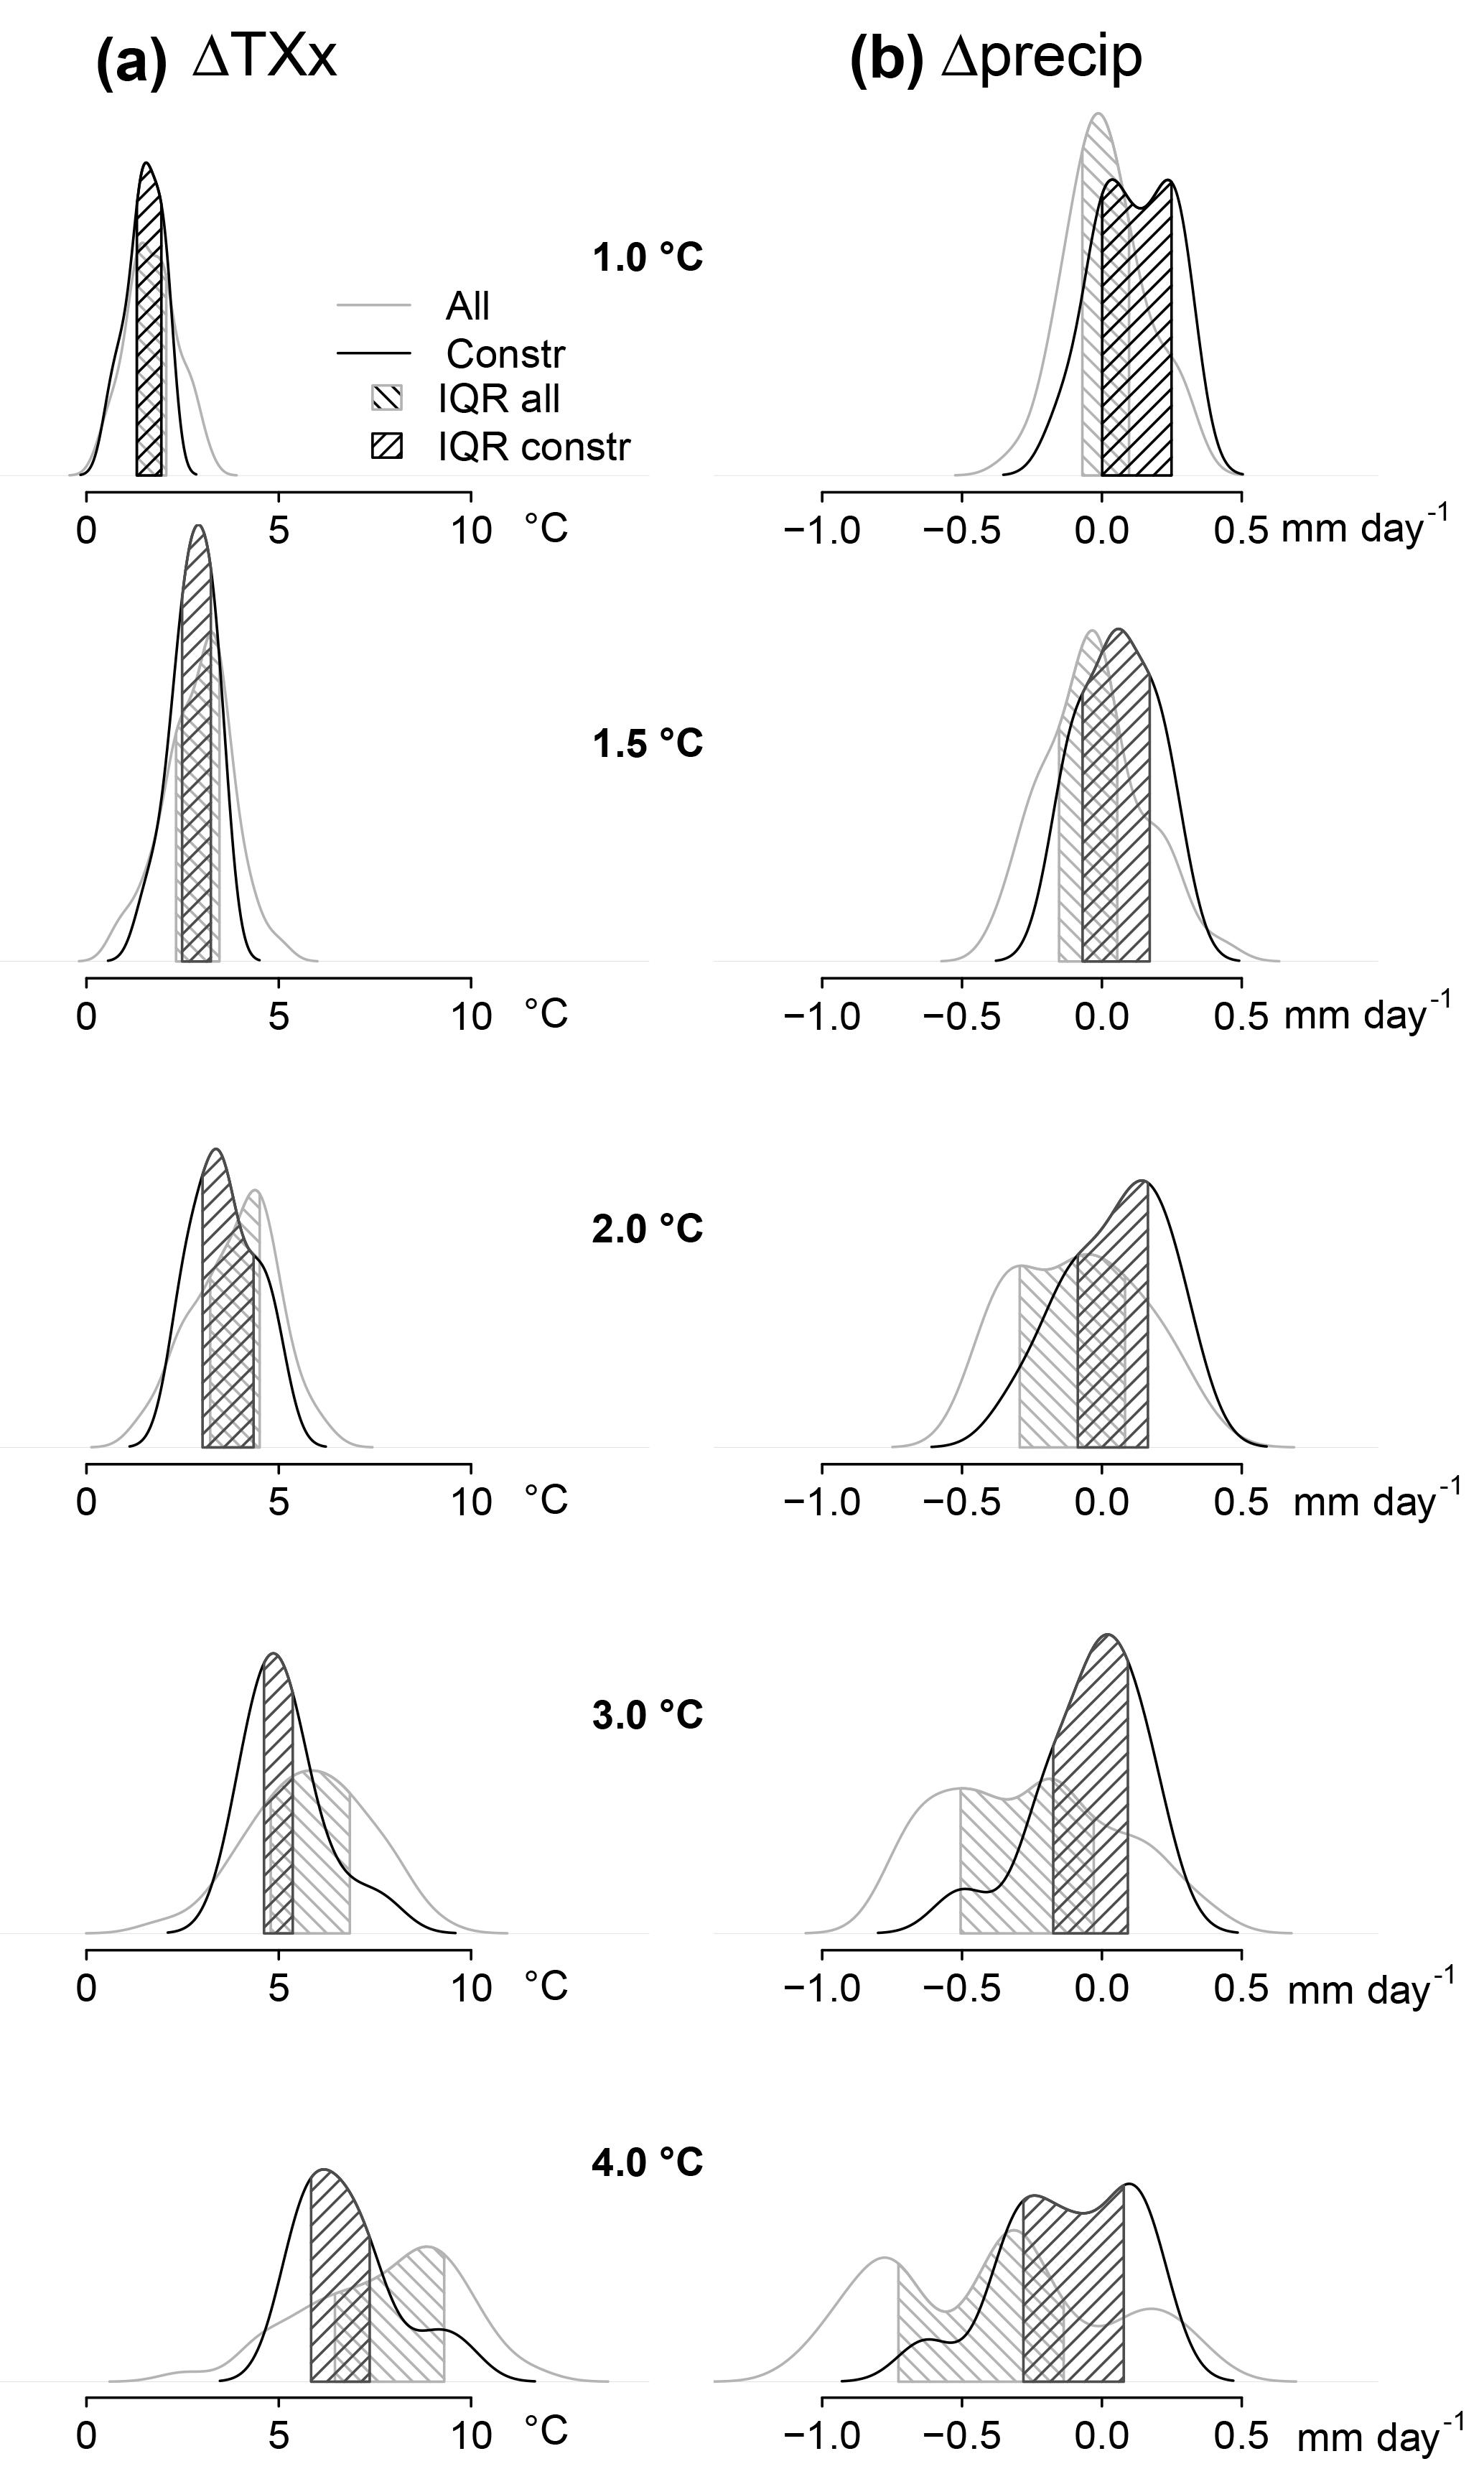
Figure 8Distribution of TXx (a) and precipitation (b) changes according to global warming levels of 1, 1.5, 2, 3 and 4 ∘C for the full (grey) and the constrained ensemble (black). The shaded area represents the interquartile range (IQR) of the two distributions.
4.1 Feedbacks
In our study we identify wet, dry and very dry models for CEU with distinct characteristics for latent heat flux, soil moisture and TXx (Table 1), indicating the importance of the interactions between land and atmosphere in ESMs. The different characteristics hint towards systematic differences in models with respect to these land–atmosphere feedbacks.
Our analysis suggests that there are three primary positive feedbacks which are relevant for uncertainties in TXx projections in the multi-model ensemble: (1) the soil moisture–temperature feedback, (2) the soil moisture–precipitation feedback and (3) the soil moisture–radiation feedback (Fig. 9).
To understand feedback (1), we investigate model experiments from the GLACE-CMIP5 ensemble with and without prescribed soil moisture (GLACE CTL and GLACE SM20c). The difference between GLACE CTL and GLACE SM20C only results from suppressing soil moisture–climate feedbacks (Fig. 3). A drying of soils leads to a decrease of the latent heat flux associated with an increase in temperature, which in turn further enhances latent heat flux and decreases soil moisture (Fig. 9, red). In particular, the time series of the very dry models suggest that a strong soil moisture–temperature feedback enhances TXx (Figs. 1 and 2). This is in agreement with several studies which have shown that in CEU the particularly strong temperature increase of hot extremes is mostly related to soil moisture–temperature feedbacks (Seneviratne et al., 2006; Fischer et al., 2007; Diffenbaugh and Ashfaq, 2010; Whan et al., 2015; Lorenz et al., 2016; Vogel et al., 2017). Donat et al. (2017) showed that an increase in TXx is associated with an increase in sensible heat and a decrease in the latent heat flux on the specific day when the hot extreme occurs, which is associated with soil moisture drying. In particular, the projected drying trends in soil moisture lead to increases in intensity, frequency and duration of temperature extremes by the end of the 21st century (Lorenz et al., 2016).
In addition to this first feedback, we identify feedback (2), the soil moisture–precipitation feedback, as a relevant driver for TXx uncertainty in the model ensemble. Under moisture limitation, a soil moisture increase leads to a latent heat flux increase; thus, cloud cover increases and results in an increase in precipitation which further increases soil moisture (Fig. 9, blue). This feedback can dampen TXx via feedback (1), the soil moisture–temperature feedback, if advection is negligible. Note that moisture convection from a distant source might change the water budget of a region, but here we focus on local processes and discuss the role of dynamics in the next section. In particular, we find that the wet models show increases in the latent heat flux and precipitation, and less strong increases in TXx. The GLACE-CMP5 experiments support the hypothesis that this feedback plays an important role in determining the magnitude of the trends in TXx and reveal the relevance of moisture recycling in the models (Fig. 3). If soil moisture in summer dries throughout CEU due to an increased atmospheric demand associated with warmer temperatures in a future climate, this feedback mechanism can amplify the increase in TXx as discussed above for the very dry and dry models. A measure of the effect of feedback (2) on temperature is the correlation of precipitation and TXx. Multiple studies have highlighted that the dominant pathway for negative correlations between seasonal temperature and precipitation is via the direct control of soil moisture on surface heat flux partitioning (Trenberth and Shea, 2005; Berg et al., 2015; Zscheischler and Seneviratne, 2017). Our results show that this correlation strongly influences future projections of hot extremes. The most negative present-day correlations show the strongest warming for TXx (Fig. 5a). However, the influence of initial changes in precipitation on soil moisture cannot be studied with this setup, and ESM model experiments with prescribed precipitation are not available. In addition to strong effects from soil moisture changes, we expect a causal relationship from precipitation to soil moisture.
Furthermore, we identify that feedback (3), the soil moisture–radiation feedback (via changes in cloud cover), additionally effects TXx. A decrease in soil moisture decreases latent heat flux, which can decrease cloud cover and enhance incoming shortwave radiation. This can directly increase latent heat flux and also decrease soil moisture via an increase in temperature and latent heat flux (Fig. 9, yellow). We find that very dry models, in particular, show a strong increase in shortwave radiation at the surface in summer. This is likely related to a decrease in cloud cover. Clouds can reflect shortwave radiation at the top of the atmosphere meaning that less shortwave radiation reaches the ground. Net radiation does not increase more strongly in very dry models, indicating that an increase in incoming shortwave radiation is not caused by an overall increase in net radiation. These considerations are in agreement with studies showing a significant decline in cloudiness over Europe, associated with an increase in solar radiation at the surface (Wild et al., 2015; Bartók et al., 2017). Bartók et al. (2017) also stated that this decline might be related to a drying in summer over Europe, limiting the amount of water available for cloud formation. In addition, cloud formation strongly depends on aerosols. Interestingly, most of the GCMs from CMIP5 underestimate the “brightening” over Europe, which is likely due to the inappropriate trends in aerosol atmospheric content (Cherian et al., 2014). This would explain the difference in temperature trends between ESMs and observations. Conversely, a positive trend in incoming shortwave radiation over Europe is likely the result of declining aerosol burdens (Wild et al., 2015).
The constrained ensemble indicates that a very strong increase in incoming shortwave radiation is less likely since we exclude most of the very dry and dry models. This would support the findings of Wild et al. (2013), who demonstrated that CMIP5 models tend to overestimate incoming solar shortwave radiation, which is consistent with an underestimation of low- and mid-level clouds (Zhang et al., 2005).
Overall, our results suggest that the three feedbacks, illustrated in Fig. 9, considerably contribute to uncertainties in TXx projections as the representation of processes that govern these three feedback mechanisms may differ largely across models. We show that the divergent behavior in precipitation projections, associated with divergent behavior in latent heat flux and different drying pathways of soil moisture can explain trends and large uncertainties in TXx. This reveals that thermodynamical aspects associated with climate change play a major role in determining changes in temperature extremes in Europe.
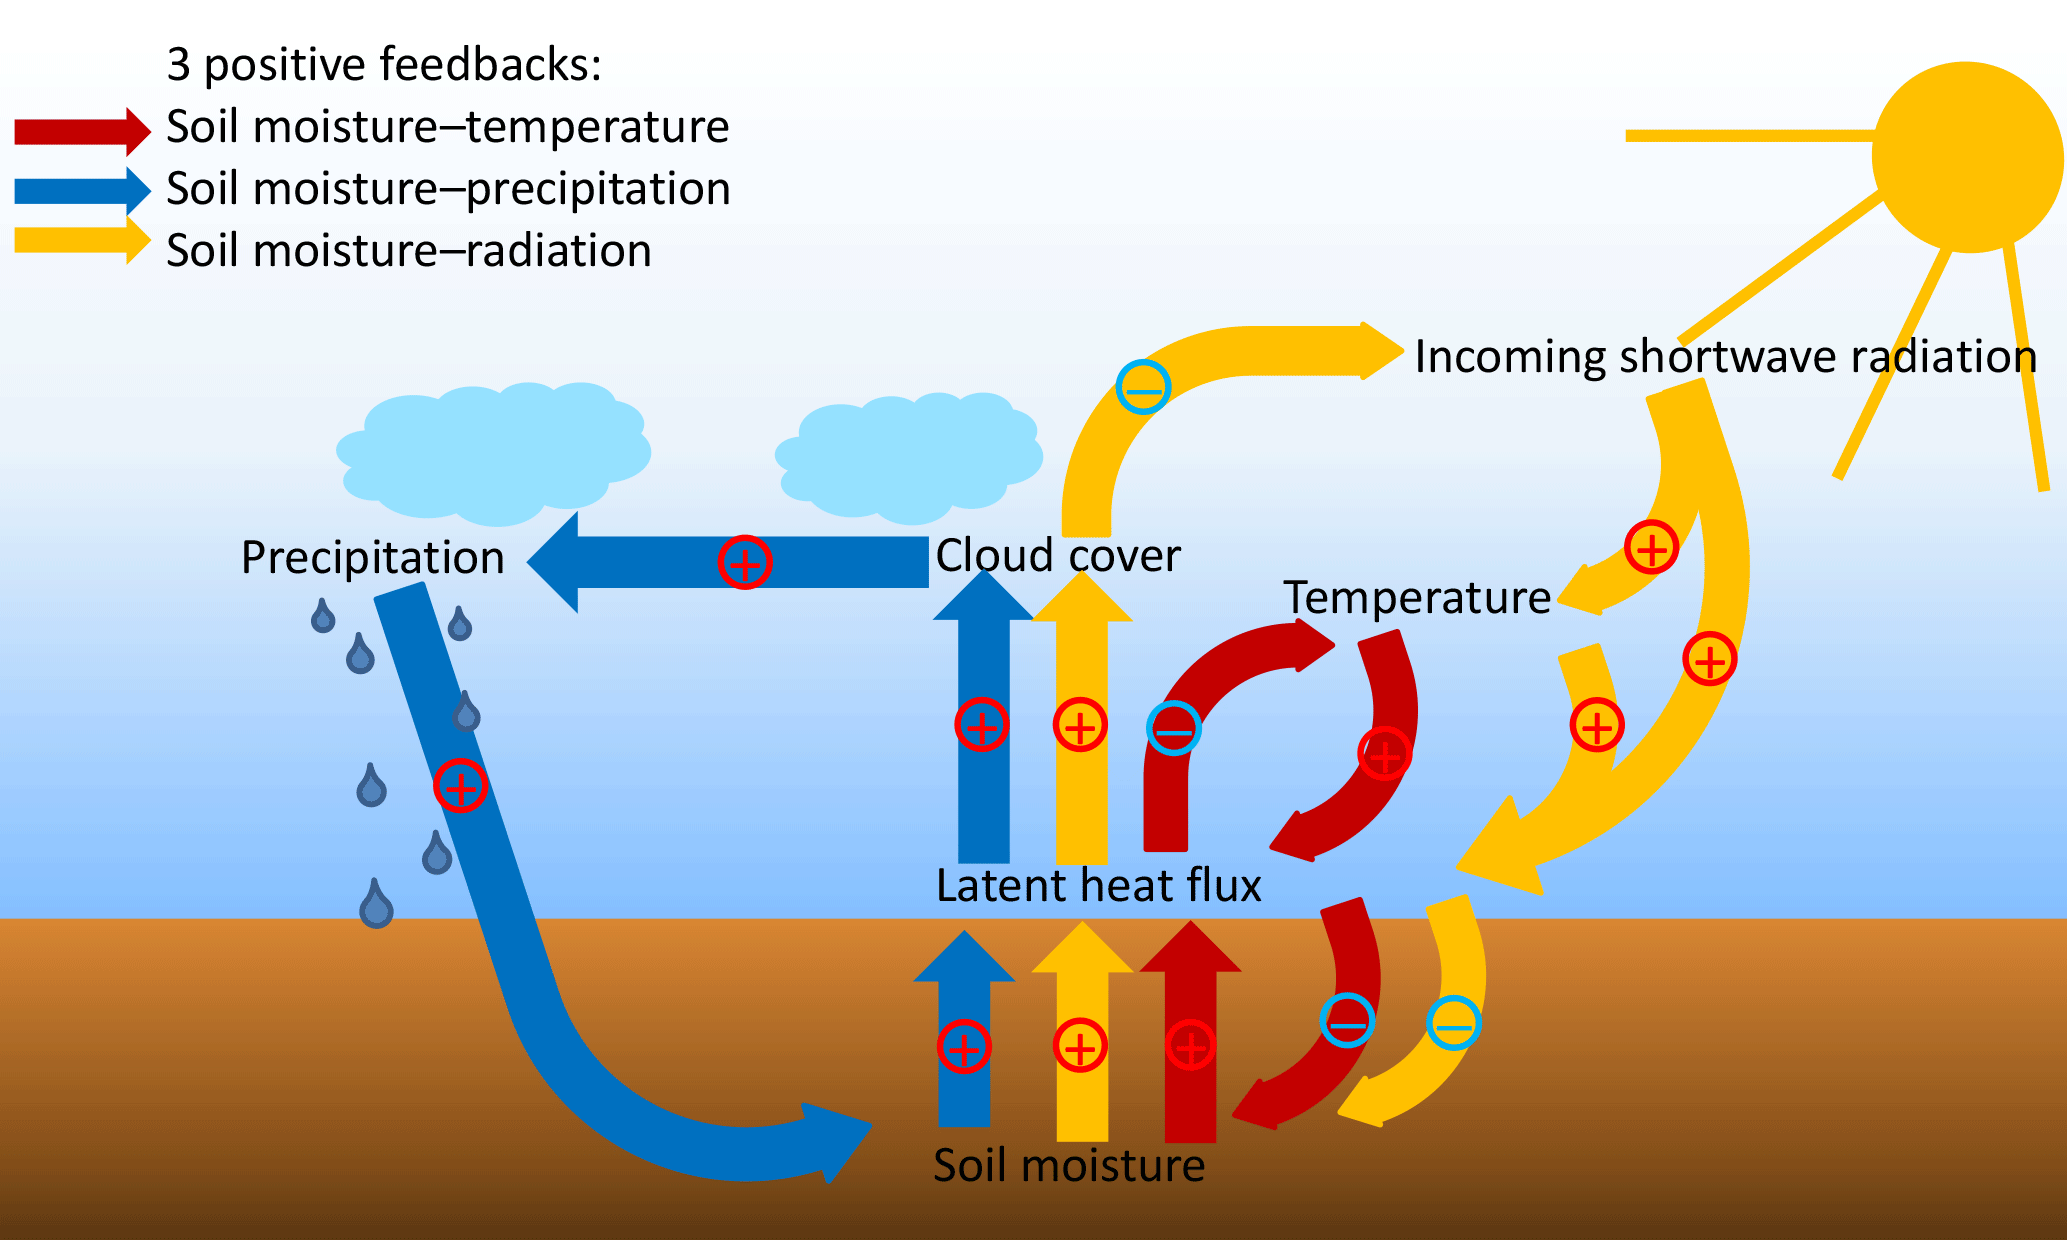
Figure 9Soil moisture–atmosphere feedbacks. The plus and minus indicate positive and negative feedback loops, respectively. The colors show the soil moisture–temperature (red), the soil moisture–precipitation (blue) and the soil moisture–radiation (yellow) feedback loops.
4.2 The role of dynamics
Previous studies have shown that in addition to soil moisture drying, the persistence of blockings is essential for the development of heat waves (Fischer and Schär, 2010; Pfahl and Wernli, 2012; Quesada et al., 2012; Miralles et al., 2014). Hence, changes in large-scale circulation features may also influence projected changes of temperature extremes. A recent study suggested that the observed increase in extreme summer heat over Europe is attributable to both an increasing frequency of blockings and changes in thermodynamics (Horton et al., 2015). However, CMIP5 models also exhibit large biases in blocking frequency and underestimate blocking particularly over Europe in both winter and summer (Scaife et al., 2010; Anstey et al., 2013). The uncertainty of present climate may then be transferred to future projections, where models potentially disagree on changes in circulation-related variables in many regions (Shepherd, 2014). A case study in Australia has shown that uncertainties in the climatological frequency of blockings can cause uncertainties in the transition and persistence of them (Gibson et al., 2016). Therefore, reducing uncertainties in large-scale circulation patterns in climate models might be a promising avenue to reduce the uncertainties in temperature extremes.
When analyzing the partitioning of precipitation into convective and stratiform precipitation, we find large changes in convective precipitation as well as in the clustering of the three identified subgroups. This indicates that the divergent model behavior is linked to local convection rather than changes in large-scale circulation. To further investigate the role of atmospheric dynamics we analyzed changes in geopotential height (500 hPa) in summer and could not identify any systematic differences between the different model groups. These results complement findings from Teng et al. (2016) who showed that projected changes of heat waves in the US are primarily caused by local land–atmosphere feedbacks and not by changes in atmospheric circulation (i.e., planetary wave variability). Overall, the present analyses and inferences from reviewed literature suggest that local land–atmosphere feedbacks play a dominant role regarding projected changes of TXx in CEU rather than changes of dynamics.
4.3 The choice of the constraint
When applying cor(TXx, precip) as a bivariate process-based metric, we derive a “constrained” ensemble which suggests a less strong projected drying and temperature increase than for the multi-model median of the whole ensemble. The uncertainties in TXx are strongly reduced (about a 20 % less strong increase compared to the full model ensemble) and we can particularly exclude very hot and very dry models.
However, our results depend on the following: (i) the choice of the constraint itself, (ii) the quality of the underlying observations and (iii) the criterion to determine the range for the model selection.
Regarding (i), we derive cor(TXx, precip) as a constraint as our analysis shows an important relationship between summer precipitation and TXx. We choose 1961–1990 as the present-day period; this period is commonly used and does not include intense warming trends observed after 2000. For the future period we select the last 30 years from the projections, 2071–2100. The overall negative correlations between summer temperatures and precipitation can be explained with soil moisture–atmosphere coupling and is a well-known feature of terrestrial climate (Madden and Williams, 1978; Trenberth and Shea, 2005; Berg et al., 2015; Zscheischler and Seneviratne, 2017). Future and present correlations show a significant relationship (R=0.73, p<0.001) which makes the coupling a model intrinsic characteristic and provides confidence that this metric can serve as a useful constraint (Fig. 5a). Furthermore, the strength of this correlation is associated with the magnitude of the TXx increase (Fig. 5b). In contrast to only using a single variable as a constraint, this metric captures the precipitation–temperature coupling as process-based constraint. A bivariate correlation-based metric has frequently been used in the past to test and investigate land–atmosphere coupling (Seneviratne et al., 2006; Hirschi et al., 2011; Lorenz et al., 2012; Miralles et al., 2012).
To ensure (ii), the quality of the underlying observations, we use five state-of-the-art gridded observational datasets for precipitation and TXx, which provide sufficiently long and high-quality information for CEU. EOBS, CRU, HadEX (only TXx) and GPCC (only precipitation) are based on station observations, while Princeton and GSWP3 are high-quality forcing datasets for land surface models. These datasets are well established and continuously updated. GWSP3 is the newest forcing dataset, which will be used to drive the next generation of offline land surface simulations as part of CMIP6, in the context of the Land Surface, Snow, and Soil Moisture Model Intercomparison Project (LS3MIP, van den Hurk et al., 2016).
In relation to (iii), the criterion to determine the range for the model selection, the observed range is dependent on the available observations and choice of the time period. We tested the sensitivity to changing time periods and dataset, which did not qualitatively affect the conclusions of our study. To define the range, we computed the minimum and maximum correlation of the five datasets. When using a smaller (larger) threshold we would select less (more) models which would influence the reduced uncertainties but the results remained qualitatively similar and we could specifically exclude very dry and hot models.
4.4 Future projections in central Europe
Our results from the constrained model ensemble demonstrate that models which show a very strong increase in TXx at the end of the 21st century are unlikely to be realistic. These findings are qualitatively consistent with results from Sippel et al. (2017), who identified a positive bias in present-day TXx that appears related to a land-surface coupling metric derived from evapotranspiration and temperature; however, the metric when applied as constraint could not substantially reduce the spread of projections. Furthermore, Donat et al. (2017) found that an increase in sensible heat and a decrease in the latent heat flux on the specific day when the hot extreme occurs contributes to strong projected increases of TXx beyond local mean temperatures. When comparing the local scaling of TXx, with the annual mean temperature of CMIP5 models, with observations they find that this is in line with observations in CEU. While this would suggest that the simulated projected changes of TXx are realistic, and that the models that overestimate TXx might also overestimate annual mean temperature increases, resulting in the same scaling.
Our analysis suggests that most of the very dry and dry models are unrealistic. This challenges the conclusions of Orth et al. (2016), who suggested that CMIP5 models might show too little drying. However, that study was based on the analysis of a single event, whereas we consider long-term changes of 20-year means. Hagemann et al. (2009) compared projections of an ESM with a regional climate model (RCM) using similar physics packages and found a stronger warming of the ESM over catchments in CEU. They suggested that this might be related to the better representation of land–atmosphere feedbacks at a higher resolution.
However, by comparing our results with projections of additional RCMs for Europe (as part of the Coordinated Regional Climate Downscaling Experiment, CORDEX) we find highly inconsistent conclusions. When using observation-based sensible heat fluxes to constrain projections of regional climate models for Europe, Stegehuis et al. (2013) concluded that summer temperature projections may be underestimated by up to 1 ∘C regionally in central Europe.
Another RCM based study suggests that models tend to be prone to a summer temperature bias in central Europe which cannot be removed with linear bias correction due to the nonlinear behavior of soil moisture (Bellprat et al., 2013). More recently it has been suggested that many of the RCMs tend to overestimate the coupling strength in comparison to observational evapotranspiration products in large areas of central Europe (Knist et al., 2017), which would be in agreement with the behavior of global CMIP5 ESM simulations according to our findings (and also consistent with Sippel et al., 2017). However, the relatively small number of observations limits the confidence of the conclusion by Knist et al. (2017). The discrepancy between CMIP5 ESMs and RCMs might be largely driven by differences in aerosol forcing in the simulations. The RCM CORDEX simulations assume invariant aerosol climatologies, which in turn affect cloud cover, and shortwave radiation variability; thus, they can not be reproduced (Bartók et al., 2017). These effects can have various secondary effects on climate variables such as precipitation and temperature.
In this study we identify a divergent behavior of summer precipitation in long-term projections in CEU in a high-emissions multi-model ensemble. The resulting trimodal distribution of precipitation at the end of the 21st century allows for models to be classified into wet, dry and very dry models. The three identified model subgroups largely overlap for the next few decades. However, they strongly diverge after global mean warming exceeds 1.3 ∘C over preindustrial levels. We find that summer precipitation in the three different model groups is strongly related to the latent heat flux and top soil moisture and contributes to large uncertainties in TXx. Wet, dry and very dry models show different behavior, which hints to systematic differences in the representation of land–atmosphere feedbacks in the models. To understand the cause and effect of the detected changes, we investigate model experiments with prescribed soil moisture. The simulations reveal the important role of soil moisture–precipitation feedbacks for the projected precipitation decrease in CEU, in addition to the direct effect of soil moisture on temperature. This demonstrates the strong role and complexity of soil moisture feedbacks to the near-surface atmosphere and in the projected increase of extreme temperatures in CEU. We find no systematic influence of circulation effects, suggesting the minor role of dynamics in explaining uncertainties in long-term projected changes in TXx. We conclude that there are three main positive feedbacks cycles which are relevant for the observed uncertainties in TXx projections: the direct soil moisture–temperature feedback through effects of soil moisture on the partitioning of the turbulent fluxes; the soil moisture–precipitation feedback, which can enhance the projected drying; and soil moisture–radiation feedbacks, which can induce a further amplification of the surface drying.
By using the correlation between TXx and summer precipitation as a process-based constraint we can exclude the very dry and most of the dry models, resulting in a reduction of 2 ∘C in TXx in the multi-model median compared to the full ensemble, which corresponds to a reduction of TXx of 20 %. Furthermore, the constrained ensemble only shows a minor decrease in summer precipitation (−0.17 mm day−1) over CEU until the end of the 21st century.
Our study allows for the substantial reduction of uncertainties in the projected changes of TXx in CEU in ESM simulations, for first time, based on a process-based constraint. Thus, this contributes to a better understanding of why models show uncertainties in climate change projections in CEU and offers an approach to provide more informative and reliable projections of changes in summer droughts and heat waves in this region.
All CMIP5 data used are available from the public CMIP5 archive. The observational datasets (CRU, EOBS, GPCC, HadEX and Princeton) are available from the respective websites. GSWP3 is available upon request from Hyungjun Kim (hjkim@iis.u-tokyo.ac.jp). The GLACE-CMIP5 data are hosted at ETH Zurich and are available upon request (http://www.iac.ethz.ch/group/land-climate-dynamics/research/glace-cmip.html, last access: 22 August 2018, subject to the agreement of the respective modeling groups and database coordinators).
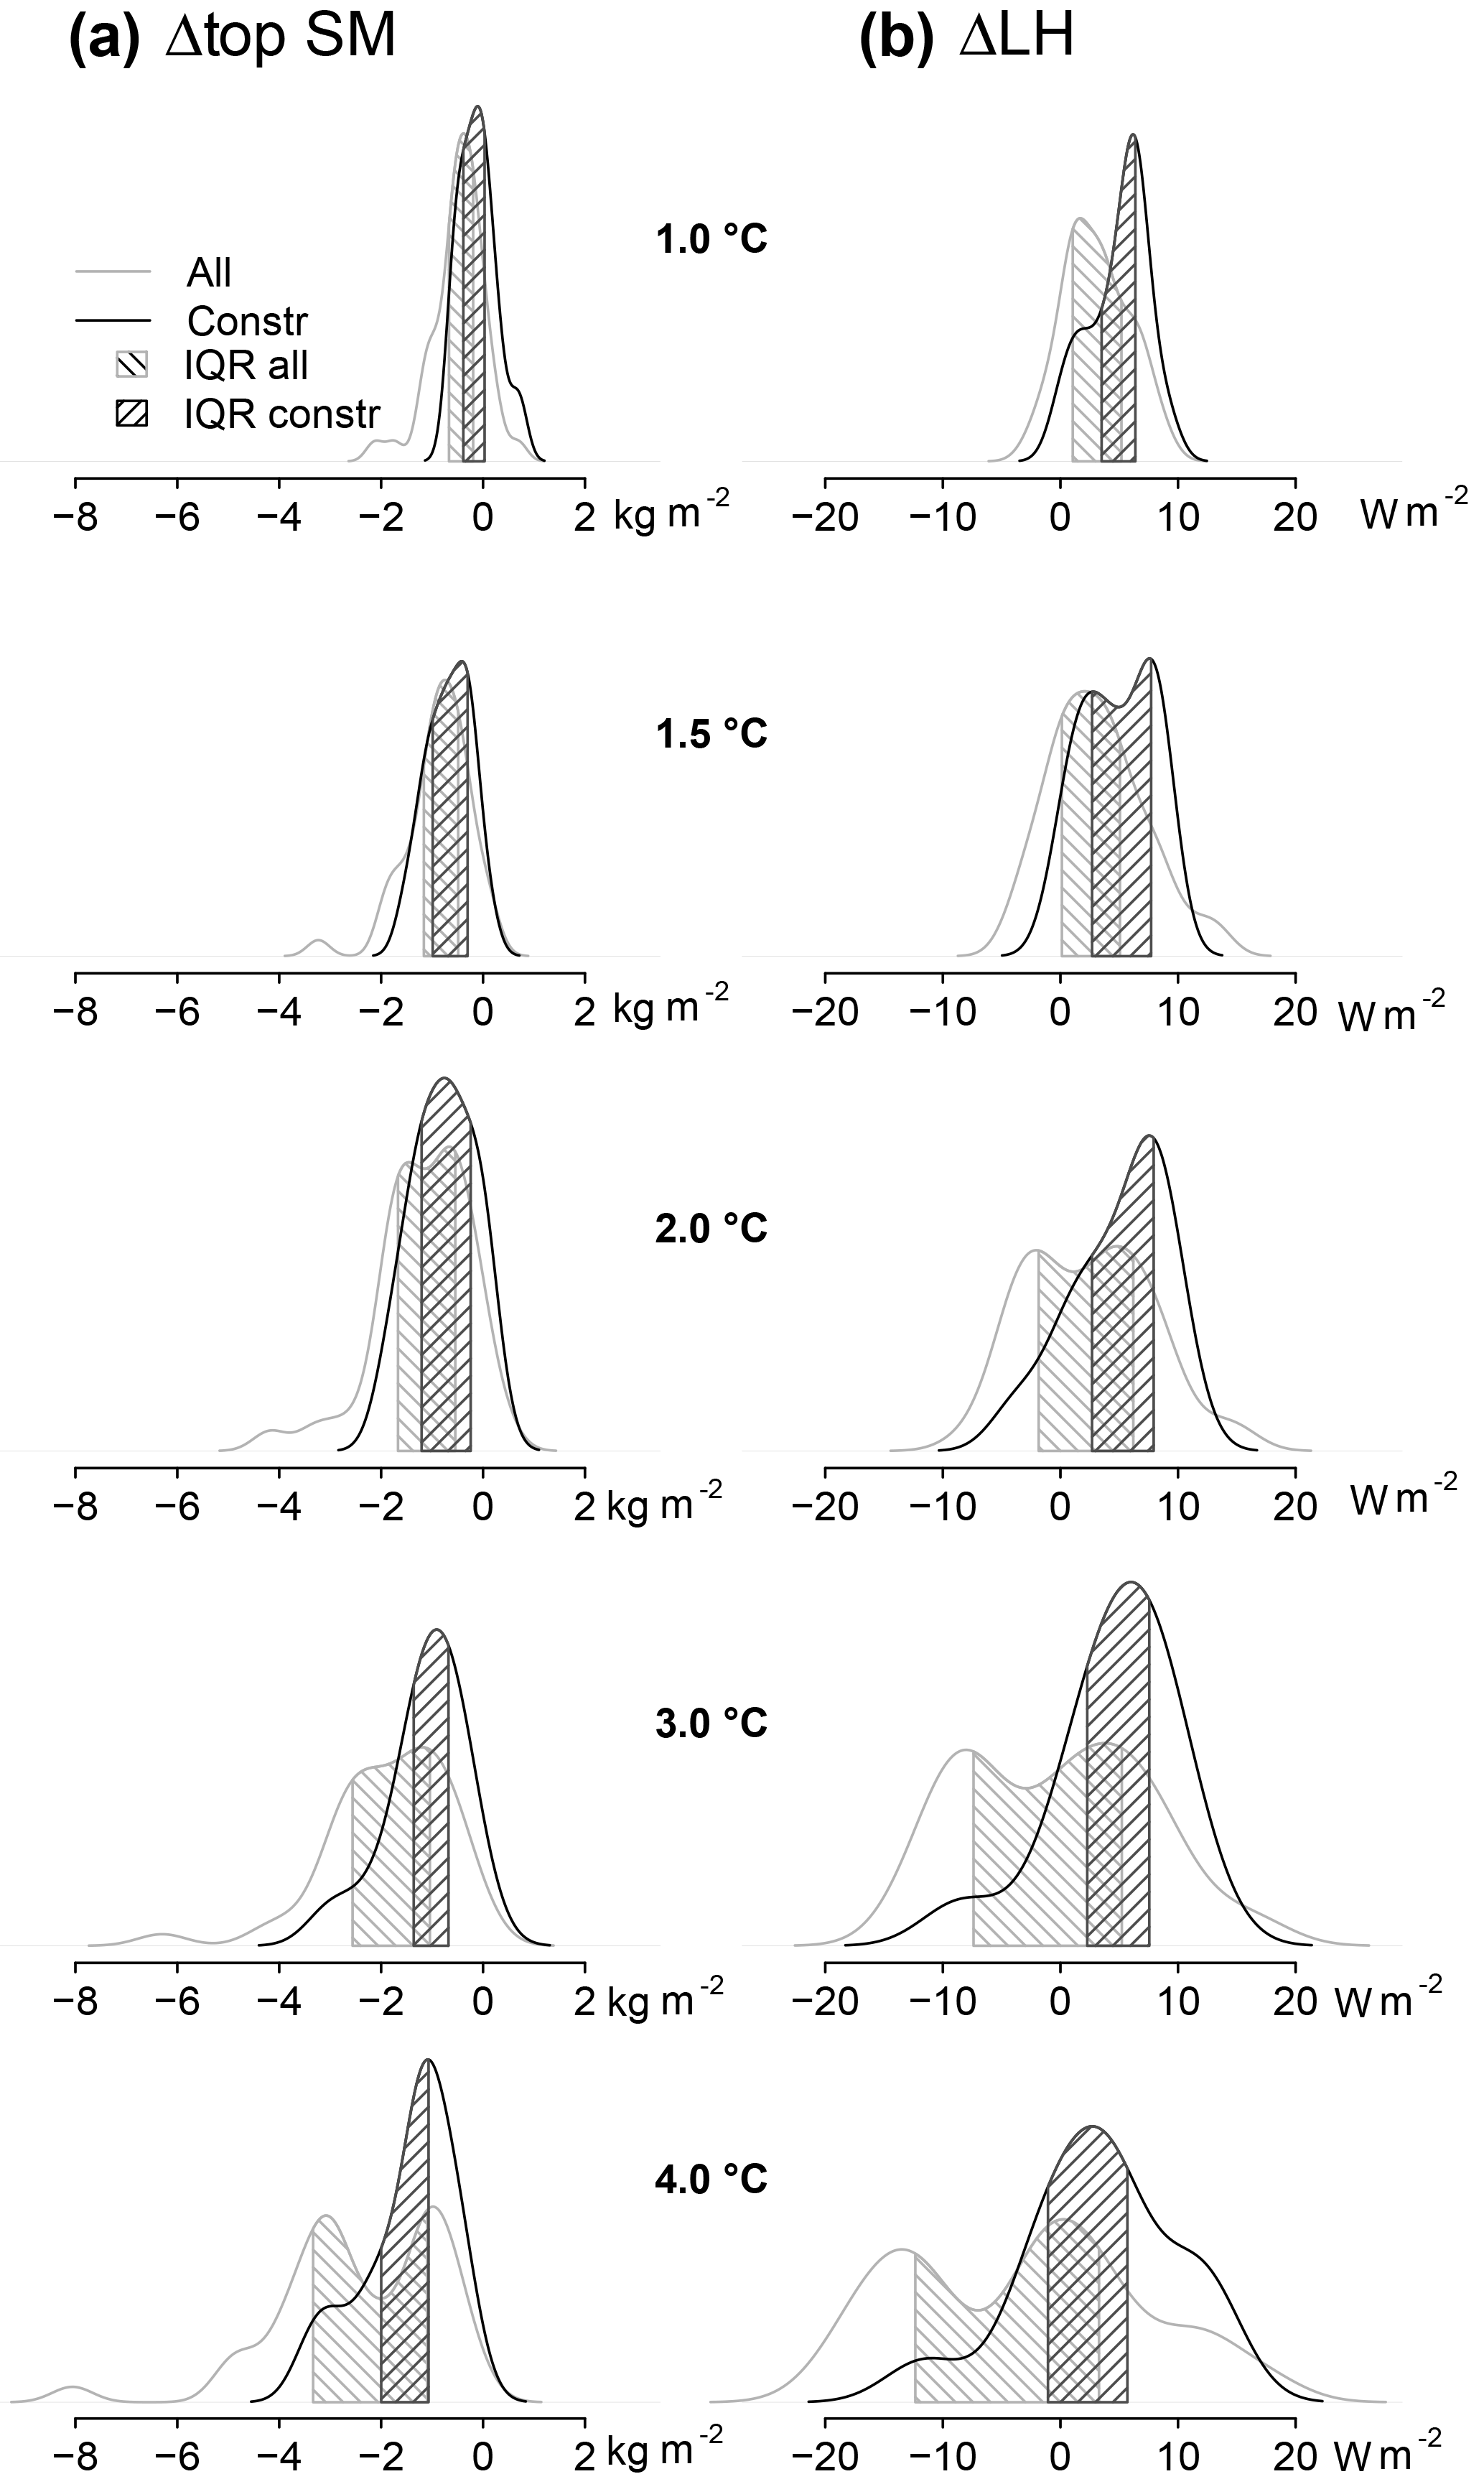
Figure A1Distribution of top soil moisture (top SM, a) and latent heat flux (LH, b) changes according to global warming levels of 1, 1.5, 2, 3 and 4 ∘C for the full (light grey) and the constrained ensemble (dark grey). The shaded area represents the interquartile range (IQR) of the two distributions.
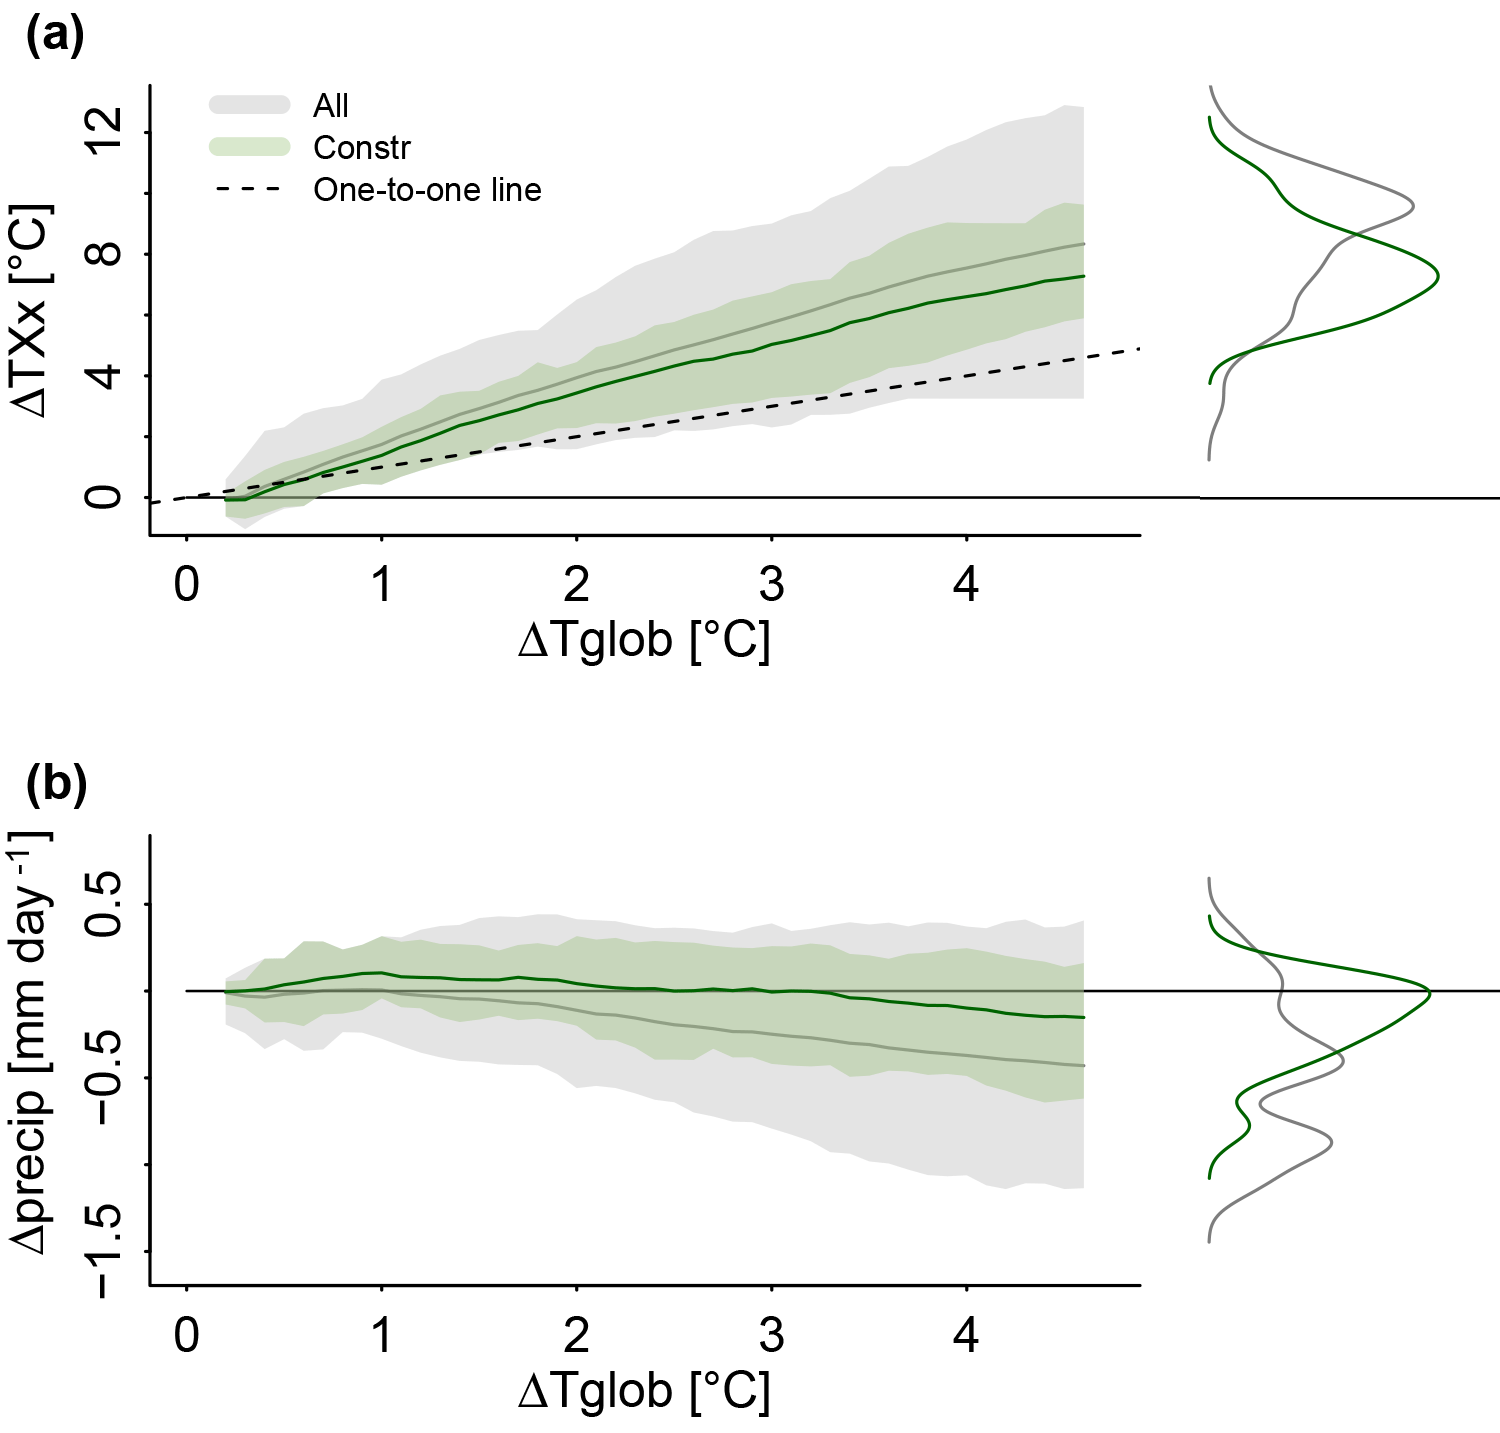
Figure A2Changes in TXx and summer precipitation in CEU versus ΔTglob. Changes are 20-year moving means starting from 1950–1969 to 2081–2100. The shaded area shows the minimum and maximum from the whole ensemble (grey) and the constrained ensemble (green).
Table A1Overview of the 23 CMIP5 models. Models marked with * are within the constrained ensemble.
MMV, JZ and SIS designed the study. MMV conducted the analysis. All authors reviewed the manuscript.
The authors declare that they have no conflict of interest.
We would like to thank René Orth for discussions regarding the initial study concept.
We thank Alexis Berg, Frederique Cheruy, Stefan Hagemann, David
Lawrence, Ruth Lorenz, Arndt Meier and Bart van den Hurk for providing the
GLACE-CMIP5 simulations. The research for this study received funding
from the European Research Council (ERC) under grant agreement number 617518
(DROUGHT-HEAT).
Edited by: Sagnik
Dey
Reviewed by: Subimal Ghosh and Stefan Hagemann
Allen, C. D., Macalady, A. K., Chenchouni, H., Bachelet, D., McDowell, N., Vennetier, M., Kitzberger, T., Rigling, A., Breshears, D. D., Hogg, E. T., Gonzalez, P., Fensham, R., Zhang, Z., Castro, J., Demidova, N., Lim, J.-H., Allard, G., Running, S. W., Semerci, A., and Cobb, N.: A global overview of drought and heat-induced tree mortality reveals emerging climate change risks for forests, Forest Ecol. Manag., 259, 660–684, https://doi.org/10.1016/j.foreco.2009.09.001, 2010. a
Anstey, J. A., Davini, P., Gray, L. J., Woollings, T. J., Butchart, N., Cagnazzo, C., Christiansen, B., Hardiman, S. C., Osprey, S. M., and Yang, S.: Multi-model analysis of Northern Hemisphere winter blocking: Model biases and the role of resolution, J. Geophys. Res.-Atmos., 118, 3956–3971, https://doi.org/10.1002/jgrd.50231, 2013. a
Barriopedro, D., Fischer, E. M., Luterbacher, J., Trigo, R. M., and García-Herrera, R.: The Hot Summer of 2010: Redrawing the Temperature Record Map of Europe, Science, 332, 220–224, https://doi.org/10.1126/science.1201224, 2011. a
Bartók, B., Wild, M., Folini, D., Lüthi, D., Kotlarski, S., Schär, C., Vautard, R., Jerez, S., and Imecs, Z.: Projected changes in surface solar radiation in CMIP5 global climate models and in EURO-CORDEX regional climate models for Europe, Clim. Dynam., 49, 2665–2683, https://doi.org/10.1007/s00382-016-3471-2, 2017. a, b, c
Bellprat, O., Kotlarski, S., Lüthi, D., and Schär, C.: Physical constraints for temperature biases in climate models, Geophys. Res. Lett., 40, 4042–4047, https://doi.org/10.1002/grl.50737, 2013. a
Berg, A., Lintner, B. R., Findell, K., Seneviratne, S. I., Van Den Hurk, B., Ducharne, A., Chéruy, F., Hagemann, S., Lawrence, D. M., Malyshev, S., Meier, A., and Gentine, P.: Interannual Coupling between Summertime Surface Temperature and Precipitation over Land: Processes and Implications for Climate Change, J. Climate, 28, 1308–1328, 2015. a, b
Boe, J. and Terray, L.: Uncertainties in summer evapotranspiration changes over Europe and implications for regional climate change, Geophys. Res. Lett., 35, 1–5, https://doi.org/10.1029/2007GL032417, 2008. a
Borodina, A., Fischer, E. M., and Knutti, R.: Potential to Constrain Projections of Hot Temperature Extremes, J. Climate, 30, 9949–9964, https://doi.org/10.1175/JCLI-D-16-0848.1, 2017. a
Cheng, L., Hoerling, M., AghaKouchak, A., Livneh, B., Quan, X.-W., and Eischeid, J.: How Has Human-Induced Climate Change Affected California Drought Risk?, J. Climate, 29, 111–120, https://doi.org/10.1175/JCLI-D-15-0260.1, 2016. a
Cherian, R., Quaas, J., Salzmann, M., and Wild, M.: Pollution trends over Europe constrain global aerosol forcing as simulated by climate models, Geophys. Res. Lett., 41, 2176–2181, https://doi.org/10.1002/2013GL058715, 2014. a
Cheruy, F., Dufresne, J. L., Hourdin, F., and Ducharne, A.: Role of clouds and land-atmosphere coupling in midlatitude continental summer warm biases and climate change amplification in CMIP5 simulations, Geophys. Res. Lett., 41, 6493–6500, https://doi.org/10.1002/2014GL061145, 2014. a, b
Christensen, J. H. and Boberg, F.: Temperature dependent climate projection deficiencies in CMIP5 models, Geophys. Res. Lett., 39, L24705, https://doi.org/10.1029/2012GL053650, 2012. a, b
Christidis, N., Stott, P. A., and Brown, S. J.: The Role of Human Activity in the Recent Warming of Extremely Warm Daytime Temperatures, J. Climate, 24, 1922–1930, https://doi.org/10.1175/2011JCLI4150.1, 2011. a
Diffenbaugh, N. S. and Ashfaq, M.: Intensification of hot extremes in the United States, Geophys. Res. Lett., 37, 1–5, https://doi.org/10.1029/2010GL043888, 2010. a
Dirmeyer, P. A., Gao, X., Zhao, M., Guo, Z., Oki, T., and Hanasaki, N.: GSWP-2: Multimodel Analysis and Implications for Our Perception of the Land Surface, B. Am. Meteorol. Soc., 87, 1381–1398, https://doi.org/10.1175/BAMS-87-10-1381, 2006. a
Donat, M. G., Alexander, L. V., Yang, H., Durre, I., Vose, R., Dunn, R. J. H., Willett, K. M., Aguilar, E., Brunet, M., Caesar, J., Hewitson, B., Jack, C., Klein Tank, A. M. G., Kruger, A. C., Marengo, J., Peterson, T. C., Renom, M., Oria Rojas, C., Rusticucci, M., Salinger, J., Elrayah, A. S., Sekele, S. S., Srivastava, A. K., Trewin, B., Villarroel, C., Vincent, L. A., Zhai, P., Zhang, X., and Kitching, S.: Updated analyses of temperature and precipitation extreme indices since the beginning of the twentieth century: The HadEX2 dataset, J. Geophys. Res.-Atmos., 118, 2098–2118, https://doi.org/10.1002/jgrd.50150, 2013. a
Donat, M. G., Pitman, A. J., and Seneviratne, S. I.: Regional warming of hot extremes accelerated by surface energy fluxes, Geophys. Res. Lett., 44, 7011–7019, https://doi.org/10.1002/2017GL073733, 2017GL073733, 2017. a, b, c
Fischer, E. M. and Knutti, R.: Anthropogenic contribution to global occurrence of heavy-precipitation and high-temperature extremes, Nat. Clim. Change, 5, 560–564, https://doi.org/10.1038/nclimate2617, 2015. a
Fischer, E. M. and Schär, C.: Consistent geographical patterns of changes in high-impact European heatwaves, Nat. Geosci., 3, 398–403, https://doi.org/10.1038/ngeo866, 2010. a
Fischer, E. M., Seneviratne, S. I., Lüthi, D., and Schär, C.: Contribution of land-atmosphere coupling to recent European summer heat waves, Geophys. Res. Lett., 34, L06707, https://doi.org/10.1029/2006GL029068, 2007. a, b
Frank, D., Reichstein, M., Bahn, M., Thonicke, K., Frank, D., Mahecha, M. D., Smith, P., van der Velde, M., Vicca, S., Babst, F., Beer, C., Buchmann, N., Canadell, J. G., Ciais, P., Cramer, W., Ibrom, A., Miglietta, F., Poulter, B., Rammig, A., Seneviratne, S. I., Walz, A., Wattenbach, M., Zavala, M. A., and Zscheischler, J.: Effects of climate extremes on the terrestrial carbon cycle: concepts, processes and potential future impacts, Glob. Change Biol., 21, 2861–2880, https://doi.org/10.1111/gcb.12916, 2015. a
Gibson, P. B., Uotila, P., Perkins-Kirkpatrick, S. E., Alexander, L. V., and Pitman, A. J.: Evaluating synoptic systems in the CMIP5 climate models over the Australian region, Clim. Dynam., 47, 2235–2251, https://doi.org/10.1007/s00382-015-2961-y, 2016. a
Greve, P., Gudmundsson, L., and Seneviratne, S. I.: Regional scaling of annual mean precipitation and water availability with global temperature change, Earth Syst. Dynam., 9, 227–240, https://doi.org/10.5194/esd-9-227-2018, 2018. a
Gudmundsson, L. and Seneviratne, S. I.: Anthropogenic climate change affects meteorological drought risk in Europe, Environ. Res. Lett., 11, 044005, https://doi.org/10.1088/1748-9326/11/4/044005, 2016. a
Gudmundsson, L., Seneviratne, S. I., and Zhang, X.: Anthropogenic climate change detected in European renewable freshwater resources, Nat. Clim. Change, 7, 813–816, https://doi.org/10.1038/nclimate3416, 2017. a, b
Guillod, B. P., Orlowsky, B., Miralles, D. G., Teuling, A. J., and Seneviratne, S. I.: Reconciling spatial and temporal soil moisture effects on afternoon rainfall, Nat. Commun., 6, 6443, https://doi.org/10.1038/ncomms7443, 2015. a
Hagemann, S., Göttel, H., Jacob, D., Lorenz, P., and Roeckner, E.: Improved regional scale processes reflected in projected hydrological changes over large European catchments, Clim. Dynam., 32, 767–781, https://doi.org/10.1007/s00382-008-0403-9, 2009. a
Harris, I., Jones, P. D., Osborn, T. J., and Lister, D. H.: Updated high-resolution grids of monthly climatic observations – the CRU TS3.10 Dataset, Int. J. Climatol., 34, 623–642, https://doi.org/10.1002/joc.3711, 2014. a
Haylock, M. R., Hofstra, N., Klein Tank, A. M. G., Klok, E. J., Jones, P. D., and New, M.: A European daily high-resolution gridded data set of surface temperature and precipitation for 1950–2006, J. Geophys. Res., 113, D20119, https://doi.org/10.1029/2008JD010201, 2008. a
Hirschi, M., Seneviratne, S. I., Alexandrov, V., Boberg, F., Boroneant, C., Christensen, O. B., Formayer, H., Orlowsky, B., and Stepanek, P.: Observational evidence for soil-moisture impact on hot extremes in southeastern Europe, Nat. Geosci., 4, 17–21, https://doi.org/10.1038/ngeo1032, 2011. a
Horton, D. E., Johnson, N. C., Singh, D., Swain, D. L., Rajaratnam, B., and Diffenbaugh, N. S.: Contribution of changes in atmospheric circulation patterns to extreme temperature trends, Nature, 522, 465–469, https://doi.org/10.1038/nature14550, 2015. a
IPCC: Summary for Policymakers, in: Climate Change 2013: The Physical Science Basis. Contribution of Working Group I to the Fifth Assessment Report of the Intergovernmental Panel on Climate Change, edited by: Stocker, T. F., Qin, D., Plattner, G.-K., Tignor, M. M., Allen, S. K., Boschung, J., Nauels, A., Xia, Y., Bex, V., and Midgley, P. M., Cambridge University Press, Cambridge and New York, available at: https://www.ipcc.ch/pdf/assessment-report/ar5/wg1/WGIAR5_SPM_brochure_en.pdf (last access: 22 August 2018), 2013. a
Knist, S., Goergen, K., Buonomo, E., Christensen, O. B., Colette, A., Cardoso, R. M., Fealy, R., Fernández, J., García-Díez, M., Jacob, D., Kartsios, S., Katragkou, E., Keuler, K., Mayer, S., van Meijgaard, E., Nikulin, G., Soares, P. M. M., Sobolowski, S., Szepszo, G., Teichmann, C., Vautard, R., Warrach-Sagi, K., Wulfmeyer, V., and Simmer, C.: Land-atmosphere coupling in EURO-CORDEX evaluation experiments, J. Geophys. Res.-Atmos., 122, 79–103, https://doi.org/10.1002/2016JD025476, 2017. a, b
Koster, R. D., Dirmeyer, P. A., Guo, Z., Bonan, G., Chan, E., Cox, P., Gordon, C. T., Kanae, S., Kowalczyk, E., Lawrence, D., Liu, P., Lu, C.-H., Malyshev, S., McAvaney, B., Mitchell, K., Mocko, D., Oki, T., Oleson, K., Pitman, A., Sud, Y. C., Taylor, C. M., Verseghy, D., Vasic, R., Xue, Y., and Yamada, T.: Regions of Strong Coupling Between Soil Moisture and Precipitation, Science, 305, 1138–1140, https://doi.org/10.1126/science.1100217, 2004. a, b
Lorenz, R., Davin, E. L., and Seneviratne, S. I.: Modeling land-climate coupling in Europe: Impact of land surface representation on climate variability and extremes, J. Geophys. Res., 117, 1–16, https://doi.org/10.1029/2012JD017755, 2012. a, b
Lorenz, R., Argüeso, D., Donat, M. G., Pitman, A. J., Hurk, B. V. D., Berg, A., Lawrence, D. M., Chéruy, F., Ducharne, A., Hagemann, S., Meier, A., Milly, P. C. D., and Seneviratne, S. I.: Influence of land-atmosphere feedbacks on temperature and precipitation extremes in the GLACE-CMIP5 ensemble, J. Geophys. Res.-Atmos., 121, 607–623, https://doi.org/10.1002/2015JD024053, 2016. a, b, c
Madden, R. A. and Williams, J.: The Correlation between Temperature and Precipitation in the United States and Europe, Mon. Weather Rev., 106, 142–147, https://doi.org/10.1175/1520-0493(1978)106<0142:TCBTAP>2.0.CO;2, 1978. a
Meinshausen, M., Smith, S. J., Calvin, K., Daniel, J. S., and Kainuma, M. L. T.: The RCP greenhouse gas concentrations and their extensions from 1765 to 2300, Climate Change, 109, 213–241, https://doi.org/10.1007/s10584-011-0156-z, 2011. a, b
Miralles, D. G., Berg, M. J. V. D., Teuling, A. J., and Jeu, R. A. M. D.: Soil moisture-temperature coupling: A multiscale observational analysis, Geophys. Res. Lett., 39, 2–7, https://doi.org/10.1029/2012GL053703, 2012. a, b
Miralles, D. G., Teuling, A. J., Van Heerwaarden, C. C., and Vilà-Guerau De Arellano, J.: Mega-heatwave temperatures due to combined soil desiccation and atmospheric heat accumulation, Nat. Geosci., 7, 345–349, https://doi.org/10.1038/NGEO2141, 2014. a
Morak, S., Hegerl, G. C., and Christidis, N.: Detectable Changes in the Frequency of Temperature Extremes, J. Climate, 26, 1561–1574, https://doi.org/10.1175/JCLI-D-11-00678.1, 2013. a
Mueller, B. and Seneviratne, S. I.: Systematic land climate and evapotranspiration biases in CMIP5 simulations, Geophys. Res. Lett., 41, 128–134, https://doi.org/10.1002/2013GL058055, 2014. a
Orlowsky, B. and Seneviratne, S. I.: Elusive drought: uncertainty in observed trends and short- and long-term CMIP5 projections, Hydrol. Earth Syst. Sci., 17, 1765–1781, https://doi.org/10.5194/hess-17-1765-2013, 2013. a
Orth, R., Zscheischler, J., and Seneviratne, S. I.: Record dry summer in 2015 challenges precipitation projections in Central Europe, Sci. Rep.-UK, 6, 28334, https://doi.org/10.1038/srep28334, 2016. a, b, c
Otto, F. E. L., Massey, N., van Oldenborgh, G. J., Jones, R. G., and Allen, M. R.: Reconciling two approaches to attribution of the 2010 Russian heat wave, Geophys. Res. Lett., 39, l04702, https://doi.org/10.1029/2011GL050422, 2012. a
Papalexiou, S. M., AghaKouchak, A., Trenberth, K. E., and Foufoula-Georgiou, E.: Global, Regional, and Megacity Trends in the Highest Temperature of the Year: Diagnostics and Evidence for Accelerating Trends, Earth's Future, 6, 71–79, https://doi.org/10.1002/2017EF000709, 2018. a
Pfahl, S. and Wernli, H.: Quantifying the relevance of atmospheric blocking for co-located temperature extremes in the Northern Hemisphere on (sub-)daily time scales, Geophys. Res. Lett., 39, l12807, https://doi.org/10.1029/2012GL052261, 2012. a
Quesada, B., Vautard, R., Yiou, P., Hirschi, M., and Seneviratne, S. I.: Asymmetric European summer heat predictability from wet and dry southern winters and springs, Nat. Clim. Change, 2, 736–741, https://doi.org/10.1038/nclimate1536, 2012. a, b
Rahmstorf, S. and Coumou, D.: Increase of extreme events in a warming world, P. Natl. Acad. Sci. USA, 108, 17905–17909, https://doi.org/10.1073/pnas.1101766108, 2011. a
Robine, J.-M., Cheung, S. L. K., Roy, S. L., Oyen, H. V., Griffiths, C., Michel, J.-P., and Herrmann, F. R.: Death toll exceeded 70 000 in Europe during the summer of 2003, C. R. Biol., 331, 171–178, https://doi.org/10.1016/j.crvi.2007.12.001, 2008. a
Sanchez-Lorenzo, A., Wild, M., Brunetti, M., Guijarro, J. A., Hakuba, M. Z., Calbó, J., Mystakidis, S., and Bartok, B.: Reassessment and update of long-term trends in downward surface shortwave radiation over Europe (1939–2012), J. Geophys. Res.-Atmos., 120, 9555–9569, https://doi.org/10.1002/2015JD023321, 2015. a
Scaife, A. A., Woollings, T., Knight, J., Martin, G., and Hinton, T.: Atmospheric Blocking and Mean Biases in Climate Models, J. Climate, 23, 6143–6152, https://doi.org/10.1175/2010JCLI3728.1, 2010. a
Schneider, U., Becker, A., Finger, P., Meyer-Christoffer, A., Ziese, M., and Rudolf, B.: GPCC's new land surface precipitation climatology based on quality-controlled in situ data and its role in quantifying the global water cycle, Theor. Appl. Climatol., 115, 15–40, https://doi.org/10.1007/s00704-013-0860-x, 2014. a
Seneviratne, S. I., Lüthi, D., Litschi, M., and Schär, C.: Land-atmosphere coupling and climate change in Europe, Nature, 443, 205–209, https://doi.org/10.1038/nature05095, 2006. a, b, c, d, e, f
Seneviratne, S. I., Corti, T., Davin, E. L., Hirschi, M., Jaeger, E. B., Lehner, I., Orlowsky, B., and Teuling, A. J.: Investigating soil moisture-climate interactions in a changing climate: A review, Earth-Sci. Rev., 99, 125–161, https://doi.org/10.1016/j.earscirev.2010.02.004, 2010. a, b, c
Seneviratne, S. I., Nicholls, N., Easterling, D., Goodess, C. M., Kanae, S., Kossin, J., Luo, Y., Marengo, J., McInnes, K., Rahimi, M., Reichstein, M., Sorteberg, A., Vera, C., and Zhang, X.: Changes in climate extremes and their impacts on the natural physical environment, in: Managing the Risks of Extreme Events and Disasters to Advance Climate Change Adaptation, edited by: Field, C. B., Barros, V., Stocker, T. F., Qin, D., Dokken, D. J., Ebi, K. L., Mastrandrea, M. D., Mach, K. J., Plattner, G.-K., Allen, S. K., Tignor, M., and Midgley, P. M., A Special Report of Working Groups I and II of the Intergovernmental Panel on Climate Change (IPCC), Cambridge University Press, Cambridge, UK, and New York, NY, USA, 109–230, 2012. a, b, c
Seneviratne, S. I., Wilhelm, M., Stanelle, T., van den Hurk, B., Hagemann, S., Berg, A., Cheruy, F., Higgins, M. E., Meier, A., Brovkin, V., Claussen, M., Ducharne, A., Dufresne, J.-L., Findell, K. L., Ghattas, J., Lawrence, D. M., Malyshev, S., Rummukainen, M., and Smith, B.: Impact of soil moisture-climate feedbacks on CMIP5 projections: First results from the GLACE-CMIP5 experiment, Geophys. Res. Lett., 40, 5212–5217, https://doi.org/10.1002/grl.50956, 2013. a, b, c, d, e
Seneviratne, S. I., Donat, M. G., Pitman, A. J., Knutti, R., and Wilby, R. L.: Allowable CO2 emissions based on regional and impact-related climate targets, Nature, 529, 477–483, https://doi.org/10.1038/nature16542, 2016. a, b
Sheffield, J., Goteti, G., and Wood, E. F.: Development of a 50 year high-resolution global dataset of meteorological forcings for land surface modeling, J. Climate, 19, 3088–3111, https://doi.org/10.1175/JCLI3790.1, 2006. a
Shepherd, T. G.: Atmospheric circulation as a source of uncertainty in climate change projections, Nat. Geosci., 7, 703–708, https://doi.org/10.1038/ngeo2253, 2014. a, b
Sippel, S., Zscheischler, J., Mahecha, M. D., Orth, R., Reichstein, M., Vogel, M., and Seneviratne, S. I.: Refining multi-model projections of temperature extremes by evaluation against land-atmosphere coupling diagnostics, Earth Syst. Dynam., 8, 387–403, https://doi.org/10.5194/esd-8-387-2017, 2017. a, b, c, d, e
Stegehuis, A. I., Teuling, A. J., Ciais, P., Vautard, R., and Jung, M.: Future European temperature change uncertainties reduced by using land heat flux observations, Geophys. Res. Lett., 40, 2242–2245, https://doi.org/10.1002/grl.50404, 2013. a
Taylor, K. E., Stouffer, R. J., and Meehl, G. A.: An Overview of CMIP5 and the Experiment Design, B. Am. Meteorol. Soc., 93, 485–498, https://doi.org/10.1175/BAMS-D-11-00094.1, 2012. a, b
Teng, H., Branstator, G., Meehl, G. A., and Washington, W. M.: Projected intensification of subseasonal temperature variability and heat waves in the Great Plains, Geophys. Res. Lett., 43, 2165–2173, https://doi.org/10.1002/2015GL067574, 2016. a
Teuling, A. J., Hirschi, M., Ohmura, A., Wild, M., Reichstein, M., Ciais, P., Buchmann, N., Ammann, C., Montagnani, L., Richardson, A. D., Wohlfahrt, G., and Seneviratne, S. I.: A regional perspective on trends in continental evaporation, Geophys. Res. Lett., 36, 1–5, https://doi.org/10.1029/2008GL036584, 2009. a
Trenberth, K. E. and Shea, D. J.: Relationships between precipitation and surface temperature, Geophys. Res. Lett., 32, l14703, https://doi.org/10.1029/2005GL022760, 2005. a, b
van den Hurk, B., Kim, H., Krinner, G., Seneviratne, S. I., Derksen, C., Oki, T., Douville, H., Colin, J., Ducharne, A., Cheruy, F., Viovy, N., Puma, M. J., Wada, Y., Li, W., Jia, B., Alessandri, A., Lawrence, D. M., Weedon, G. P., Ellis, R., Hagemann, S., Mao, J., Flanner, M. G., Zampieri, M., Materia, S., Law, R. M., and Sheffield, J.: LS3MIP (v1.0) contribution to CMIP6: the Land Surface, Snow and Soil moisture Model Intercomparison Project – aims, setup and expected outcome, Geosci. Model Dev., 9, 2809–2832, https://doi.org/10.5194/gmd-9-2809-2016, 2016. a
Vogel, M. M., Orth, R., Cheruy, F., Hagemann, S., Lorenz, R., van den Hurk, B. J. J. M., and Seneviratne, S. I.: Regional amplification of projected changes in extreme temperatures strongly controlled by soil moisture-temperature feedbacks, Geophys. Res. Lett., 44, 1511–1519, https://doi.org/10.1002/2016GL071235, 2017. a, b, c, d, e
Wartenburger, R., Hirschi, M., Donat, M. G., Greve, P., Pitman, A. J., and Seneviratne, S. I.: Changes in regional climate extremes as a function of global mean temperature: an interactive plotting framework, Geosci. Model Dev., 10, 3609–3634, https://doi.org/10.5194/gmd-10-3609-2017, 2017. a
Westerling, A. L., Hidalgo, H. G., Cayan, D. R., and Swetnam, T. W.: Warming and Earlier Spring Increase Western U.S. Forest Wildfire Activity, Science, 313, 940–943, https://doi.org/10.1126/science.1128834, 2006. a
Whan, K., Zscheischler, J., Orth, R., Shongwe, M., Rahimi, M., Asare, E. O., and Seneviratne, S. I.: Impact of soil moisture on extreme maximum temperatures in Europe, Weather and Climate Extremes, 9, 57–67, https://doi.org/10.1016/j.wace.2015.05.001, 2015. a, b
Wild, M., Gilgen, H., Roesch, A., Ohmura, A., Long, C. N., Dutton, E. G., Forgan, B., Kallis, A., Russak, V., and Tsvetkov, A.: From Dimming to Brightening: Decadal Changes in Solar Radiation at Earth's Surface, Science, 308, 847–850, https://doi.org/10.1126/science.1103215, 2005. a
Wild, M., Folini, D., Schär, C., Loeb, N., Dutton, E. G., and König-Langlo, G.: The global energy balance from a surface perspective, Clim. Dynam., 40, 3107–3134, https://doi.org/10.1007/s00382-012-1569-8, 2013. a
Wild, M., Folini, D., Henschel, F., Fischer, N., and Müller, B.: Projections of long-term changes in solar radiation based on CMIP5 climate models and their influence on energy yields of photovoltaic systems, Sol. Energy, 116, 12–24, https://doi.org/10.1016/j.solener.2015.03.039, 2015. a, b
Zhang, M. H., Lin, W. Y., Klein, S. A., Bacmeister, J. T., Bony, S., Cederwall, R. T., Del Genio, A. D., Hack, J. J., Loeb, N. G., Lohmann, U., Minnis, P., Musat, I., Pincus, R., Stier, P., Suarez, M. J., Webb, M. J., Wu, J. B., Xie, S. C., Yao, M.-S., and Zhang, J. H.: Comparing clouds and their seasonal variations in 10 atmospheric general circulation models with satellite measurements, J. Geophys. Res.-Atmos., 110, d15S02, https://doi.org/10.1029/2004JD005021, 2005. a
Zhang, X., Zwiers, F. W., Hegerl, G. C., Lambert, F. H., Gillett, N. P., Solomon, S., Stott, P. A., and Nozawa, T.: Detection of human influence on twentieth-century precipitation trends, Nature, 448, 461–465, https://doi.org/10.1038/nature06025, 2007. a
Zscheischler, J. and Seneviratne, S. I.: Dependence of drivers affects risks associated with compound events, Science Advances, 3, e1700263, https://doi.org/10.1126/sciadv.1700263, 2017. a, b
Zscheischler, J., Orth, R., and Seneviratne, S. I.: A submonthly database for detecting changes in vegetation-atmosphere coupling, Geophys. Res. Lett., 42, 9816–9824, https://doi.org/10.1002/2015GL066563, 2015. a, b