the Creative Commons Attribution 4.0 License.
the Creative Commons Attribution 4.0 License.
 | 15 May 2020
Historical and future anthropogenic warming effects on droughts, fires and fire emissions of CO2 and PM2.5 in equatorial Asia when 2015-like El Niño events occur
Ryuichi Hirata
Tomoko Hasegawa
Shinichiro Fujimori
Noriko N. Ishizaki
Satoru Chatani
Masahiro Watanabe
Daniel Mitchell
Y. T. Eunice Lo
In 2015, El Niño contributed to severe droughts in equatorial Asia (EA). The severe droughts enhanced fire activity in the dry season (June–November), leading to massive fire emissions of CO2 and aerosols. Based on large event attribution ensembles of the MIROC5 atmospheric global climate model, we suggest that historical anthropogenic warming increased the chances of meteorological droughts exceeding the 2015 observations in the EA area. We also investigate changes in drought in future climate simulations, in which prescribed sea surface temperature data have the same spatial patterns as the 2015 El Niño with long-term warming trends. Large probability increases of stronger droughts than the 2015 event are projected when events like the 2015 El Niño occur in the 1.5 and 2.0 ∘C warmed climate ensembles according to the Paris Agreement goals. Further drying is projected in the 3.0 ∘C ensemble according to the current mitigation policies of nations.
We use observation-based empirical functions to estimate burned area, fire CO2 emissions and fine (<2.5 µm) particulate matter (PM2.5) emissions from these simulations of precipitation. There are no significant increases in the chances of burned area and CO2 and PM2.5 emissions exceeding the 2015 observations due to past anthropogenic climate change. In contrast, even if the 1.5 and 2.0 ∘C goals are achieved, there are significant increases in the burned area and CO2 and PM2.5 emissions. If global warming reaches 3.0 ∘C, as is expected from the current mitigation policies of nations, the chances of burned areas and CO2 and PM2.5 emissions exceeding the 2015 observed values become approximately 100 %, at least in the single model ensembles.
We also compare changes in fire CO2 emissions due to climate change and the land-use CO2 emission scenarios of five shared socioeconomic pathways, where the effects of climate change on fire are not considered. There are two main implications. First, in a national policy context, future EA climate policy will need to consider these climate change effects regarding both mitigation and adaptation aspects. Second is the consideration of fire increases changing global CO2 emissions and mitigation strategies, which suggests that future climate change mitigation studies should consider these factors.
- Article
(1126 KB) -
Supplement
(904 KB) - BibTeX
- EndNote


El Niño events, often characterised by their positive sea surface temperature (SST) anomalies in the central and eastern tropical Pacific Ocean, accompany a weakening of the Walker circulation in the equatorial Pacific region. In the equatorial Asia region (EA, the area denoted in Fig. 1g), the weakening of the Walker circulation due to major El Niño events corresponds to downward motion anomalies and less convection (negative precipitation anomalies) (Santoso et al., 2017). The 2015/2016 major El Niño event (the strongest since 1997/1998) induced negative precipitation anomalies and enhanced the severe drought in the EA region during the dry season (June–November) of 2015 (Field et al., 2016; Liu et al., 2017; Santoso et al., 2017). Parts of the EA region are tropical peatlands that contain tremendous amounts of soil organic carbon (Page et al., 2011) and huge biomass (Baccini et al., 2012, 2017; Saatchi et al., 2011). Coupled with anthropogenic land-use change (e.g. expansion of oil palm plantations on peatlands), the severe drought increased fire activity in forests and peatlands, leading to large economic losses (at least USD 16.1 billion for Indonesia) and significant impacts on ecology and human health (Taufik et al., 2017; World Bank, 2016; Hartmann et al., 2018). The fires enhanced the emissions of CO2 and aerosols (Yin et al., 2016; Field et al., 2016; Koplitz et al., 2016; Stockwell et al., 2016; Liu et al., 2017). The fire carbon emissions of 2015 were the largest since the 1997 El Niño event (Yin et al., 2016). The estimated 2015 CO2-equivalent biomass burning emissions for all Indonesia (1.5 billion metric tons of CO2) were between the 2013 annual fossil fuel CO2 emissions of Japan and India (Field et al., 2016). The massive emissions of ozone precursors and aerosols, including fine (<2.5 µm) particulate matter (PM2.5), caused severe haze across much of EA (Field et al., 2016), resulting in the excess deaths of approximately 100 300 people (Koplitz et al., 2016).
In a previous study (Lestari et al., 2014), we suggested that recent fire events in Sumatra were exacerbated by human-induced drying trends based on analyses of two sets of historical simulations of the MIROC5 atmospheric global climate model (AGCM) (Watanabe et al., 2010) with and without anthropogenic warming. Lestari et al. (2014) and Yin et al. (2016) projected future increases in the frequency of droughts and fires based on analyses of the coupled atmosphere–ocean global climate model (AOGCM) ensembles of the Coupled Model Intercomparison Project Phase 5 (CMIP5) (Taylor et al., 2012).
Although Lestari et al. (2014) showed the anthropogenic effects on the historical trends in droughts, it is not clear how historical climate change affected the particular drought event of 2015. Because extreme events can occur by natural variability alone, it is difficult in principle to attribute a particular event to anthropogenic climate change. However, comparisons of observations and large ensemble simulations can help us evaluate the degree to which human influence has affected the probability of a particular event (Allen, 2003). Such an approach is called probabilistic event attribution (PEA) (Pall et al., 2011; Shiogama et al., 2013). In the PEA approach, two sets of large ensembles (e.g. 100 members) are generally performed. The first is historical simulations of an AGCM driven by the historical values of anthropogenic (e.g. greenhouse gases) and natural forcing (solar and volcanic activities) agents and by the observed SST and sea ice concentration (SIC). The second is counterfactual natural runs driven by pre-industrial anthropogenic and historical natural forcing agents and by the observed values of SST and SIC cooled according to estimates of anthropogenic warming (Stone et al., 2019) (see Sect. 3 for more details). Note that the components of interannual variations in the SST data are not modified in the natural forcing ensemble. Therefore, for example, we can assess how anthropogenic warming affected the probabilities of drought events exceeding the observed value in the 2015 major El Niño event by comparing the distributions of members in historical and natural forcing ensembles. In this study, based on the PEA approach, we examine whether historical climate change increased not only the probabilities of drought but also those of fire and fire emissions of CO2 and PM2.5 during the June–November dry season of 2015. The lower computing costs of AGCM compared to AOGCM enable us to perform large ensembles, which are necessary for PEA. We use the 100-member PEA ensembles of MIROC5 (Shiogama et al., 2014) that have been used for many attribution studies on single extreme events (e.g. Shiogama et al., 2014; Kim et al., 2018; Hirota et al., 2018).
Although Lestari et al. (2014) and Yin et al. (2016) showed increases in droughts and fires in the future transient projection ensembles of AOGCMs, it is not clear how future anthropogenic warming affects droughts and fire when events like the 2015 El Niño occur in a future warmer climate. It is also important to investigate changes in extreme events at 1.5 and 2.0 ∘C warming levels to inform stakeholders, since the Paris Agreement set the 1.5 ∘C and 2 ∘C long-term climate stabilisation goals (United Nations Framework Convention on Climate Change, 2015). In this study, we examine how the probabilities of drought, fire and fire emissions of CO2 and PM2.5 would change when major El Niño events like 2015 occur in 1.5 and 2.0 ∘C warmed climates. We analyse large (100-member) ensembles of the MIROC5 AGCM under the Half a degree Additional warming, Prognosis and Projected Impacts (HAPPI) project, which was initiated in response to the Paris Agreement (Mitchell et al., 2016, 2017, 2018; Shiogama et al., 2019). These MIROC5 HAPPI ensembles have been used, for example, to study the changes in extremely hot days (Wehner et al., 2018), extreme heat-related mortality (Mitchell et al., 2018), tropical rainy season length (Saeed et al., 2018) and global drought (Liu et al., 2018) at 1.5 and 2.0 ∘C global warming. There is a significant “emissions gap”, which is the gap between where we are likely to be and where we need to be (United Nations Environment Programme, 2018). The current mitigation policies of nations would lead to global warming of approximately 3.2 ∘C (with a range of 2.9–3.4 ∘C) by 2100 (United Nations Environment Programme, 2018). Therefore, it is worthwhile to compare changes in extreme events and impacts in cases where the 1.5 and 2.0 ∘C goals are achieved and where they are not. Therefore, we perform and analyse a large ensemble of a 3.0 ∘C warmed climate.
By using the above ensembles, we answer the following questions:
- a.
Has historical climate change significantly affected the probabilities of drought, fire and fire emissions of CO2 and PM2.5?
- b.
How do the probabilities of drought, fire and fire emissions in 2015-like major El Niño years change if we can limit global warming to 1.5 and 2.0 ∘C? Adaptation investments are necessary to reduce the associated impacts.
- c.
If we overshoot the 1.5 and 2.0 ∘C goals to the current trajectory of 3.0 ∘C, how will drought, fire and fire emissions be altered? A comparison of the results for 1.5/2.0 and 3.0 ∘C indicates the potential benefits of mitigation efforts to achieve the goals of the Paris Agreement.
Although conversions of forest and peatlands to agriculture and plantations of oil palm are also important factors for fire activity (Marlier et al., 2013, 2015; Kim et al., 2015), we do not examine the effects of land-use change in this study. In Sects. 2 and 3, we describe the empirical functions and model simulations used in this study, respectively. In Sect. 4, we examine changes in precipitation, fire and fire emissions. Finally, Sect. 5 contains the conclusions.
Figure 1a–c indicate the observed June–November 2015 mean anomalies in surface air temperature (ΔT), vertical pressure velocity at the 500 hPa level (Δω500) and precipitation (ΔP) relative to the 1979–2016 averages. ERA-Interim reanalysis (ERA-I) data (Dee et al., 2011) are used for ΔT and Δω500. Global Precipitation Climatology Project (GPCP) data (Adler et al., 2003) are analysed for ΔP. The largely positive ΔT over the eastern tropical Pacific Ocean (i.e. El Niño) is related to substantial downward motion anomalies (weakening of Walker circulation) and negative precipitation anomalies over the EA region (the area shown in Fig. 1g). The negative precipitation anomalies in June–November 2015 were the third largest since 1979 (the first and second largest anomalies are the 1997 and 1982 El Niño events).
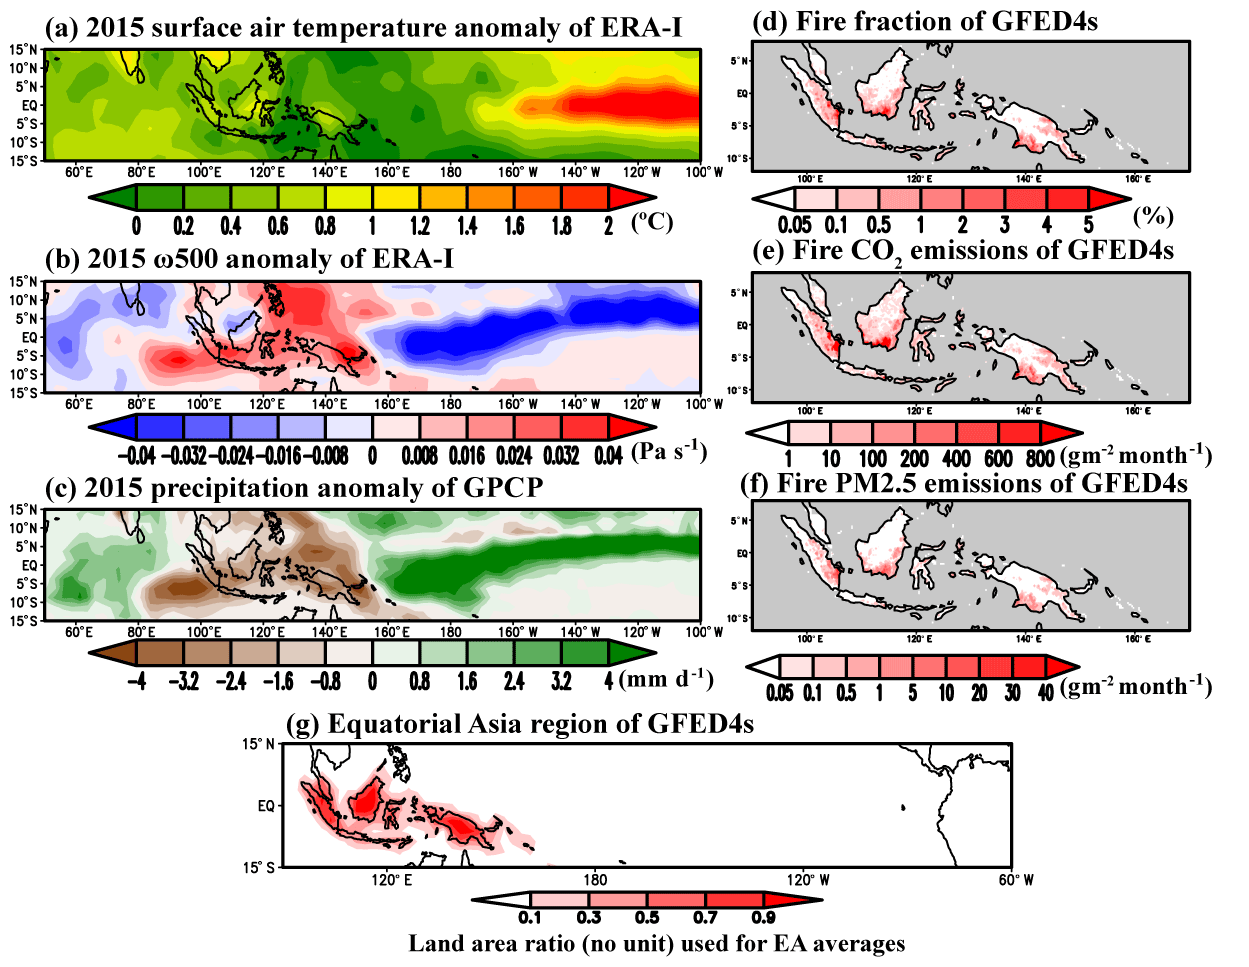
Figure 1The observed climate conditions and fires. The June–November 2015 averaged anomalies of (a) surface air temperature (∘C) and (b) vertical pressure velocity at the 500 hPa level (Pa s−1, downward motions are positive) from ERA Interim reanalysis data (Dee et al., 2011) relative to the 1979–2016 mean. (c) The June–November 2015 averaged anomalies of precipitation from GPCP (Adler et al., 2003) (mm d−1). The right panels indicate (d) fire fraction (%), (e) fire CO2 emissions (g m−2 month−1) and (f) fire PM2.5 emissions from GFED4s (van der Werf et al., 2017) between June and November 2015. (g) The red area indicates the EA region of the GFED4s. We use this definition of the EA area. Shading shows the land area ratio (no unit) used for weighting in the computation of EA averages.
In the EA region, the negative precipitation anomalies are associated with the enhanced fire fraction, fire CO2 emissions and fire PM2.5 emissions estimated from the Global Fire Emissions Database (GFED4s) (van der Werf et al., 2017) (Fig. 1d–f). By combining satellite information on fire activity and vegetation productivity, GFED4s provides monthly burned area, fire CO2 and dry matter (DM) emissions data. We can also compute aerosol emissions by multiplying DM by the provided factors. The CO2 and PM2.5 emissions increase linearly as the burned areas expand (Supplement Fig. S1). Previous studies found that fire activity and related emissions have non-linear relationships with precipitation anomalies and accumulated water deficits (Lestari et al., 2014; Spessa, et al., 2015; Yin et al., 2016; Field et al., 2016). Figure 2 shows the empirical relationships between the EA-averaged precipitation anomalies (GPCP) and the EA cumulative burned area and fire CO2 and PM2.5 emissions (GFED4s) between 1997 and 2016. Here, we remove the 1979–2016 average from precipitation and divide the anomalies by their standard deviation value. As precipitation decreases, the burned area, fire CO2 and PM2.5 emissions increase exponentially. We estimate the fitting curves (solid curves in Fig. 2) by using the following equation:
where y is the burned area, CO2 emissions or PM2.5 emissions, and a and b are the intercept and regression coefficients, respectively. The coefficients of determination (R2) are higher than 0.7. We also estimate the 10 %–90 % confidence intervals of the fitting curves by applying a 1000-time random sampling of the observed data: we randomly resample 20-year samples from the original 20-year (1997–2016) data and compute a and b; we repeat the random resampling process 1000 times; we consider that the 10th percentile and 90th percentile values of the 1000 regression lines indicate the 10 %–90 % confidence intervals. These non-linear relationships are consistent with previous studies (Lestari et al., 2014; Spessa, et al., 2015; Yin et al., 2016; Field et al., 2016). We use the relationships in Fig. 2a–c as empirical functions to estimate burned area and fire emissions from the AGCM simulations of precipitation in Sect. 4.
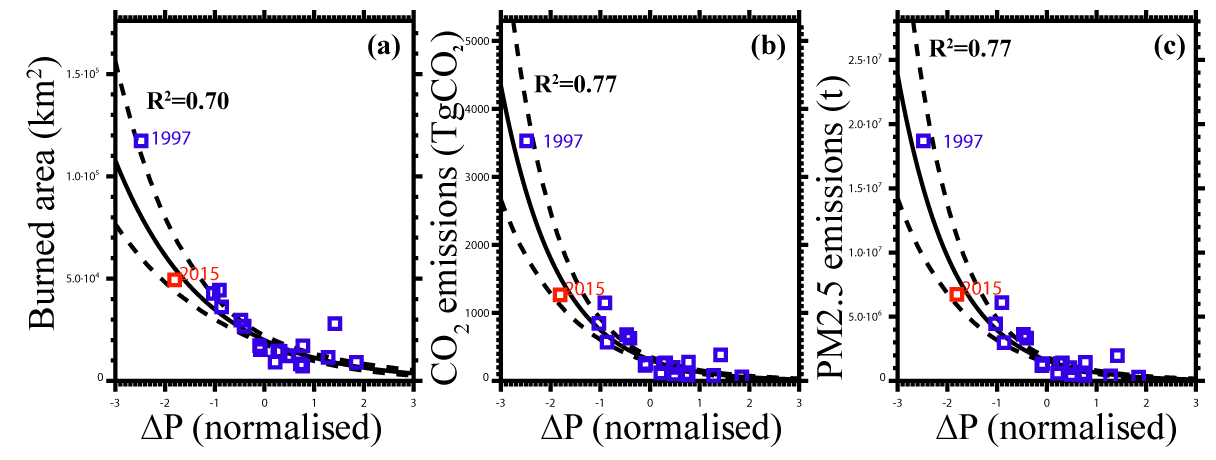
Figure 2Empirical relationships between observed precipitation anomalies, burned area and fire emissions in the EA area between 1997 and 2016. The horizontal axes are the normalised June–November mean precipitation anomalies (no unit) of the GPCP. The vertical axes denote (a) burned area (km2), (b) CO2 emissions (TgCO2) and (c) PM2.5 emissions (t) of GFED4s. The year 2015 values are indicated by red squares. Solid and dashed lines indicate the best estimates and the 10 %–90 % confidence intervals of the fitting curves from Eq. (1), respectively.
The MIROC5 AGCM (Watanabe et al., 2010) has a 160 km horizontal resolution. We perform 10-member long-term (1979–2016) historical simulations (Hist-long) of the MIROC5 AGCM forced by the observed sea surface temperature (SST) (HadISST, Rayner et al., 2003) and anthropogenic and natural external forcing factors (Shiogama et al., 2013, 2014). Here, the observed ΔP and Δω500 are divided by their standard deviation values. The ΔP and Δω500 of each ensemble member are also divided by their own standard deviation values. The correlations of the 1979–2016 time series of ΔP and Δω500 between the observations and the ensemble averages of the MIROC5 simulations are 0.90 and 0.87, respectively (Fig. 3a–b). When we apply the above normalisation process as a simple bias correction technique, it is found that the MIROC5 model has good hindcast skill regarding interannual variability in the EA-averaged ΔP and Δω500. The precipitation and vertical motion anomalies are closely related to the Niño 3.4 SST (an index of El Niño–Southern Oscillation) in the observations (correlations are −0.89 and 0.76, respectively) (Fig. 3c–d). There is also a high correlation value between ΔP and Δω500 (−0.87) (Fig. 3e). We show that El Niño (La Niña) accompanies descending wind (ascending wind) in the EA area (Fig. 3d), leading to negative (positive) ΔP (Fig. 3e and c). The MIROC5 model represents well these relationships between Niño 3.4, ΔP and Δω500 in the observations (Fig. 3c–e); i.e. the regression lines of MIROC5 in Fig. 3c–e are close to those in the observations.
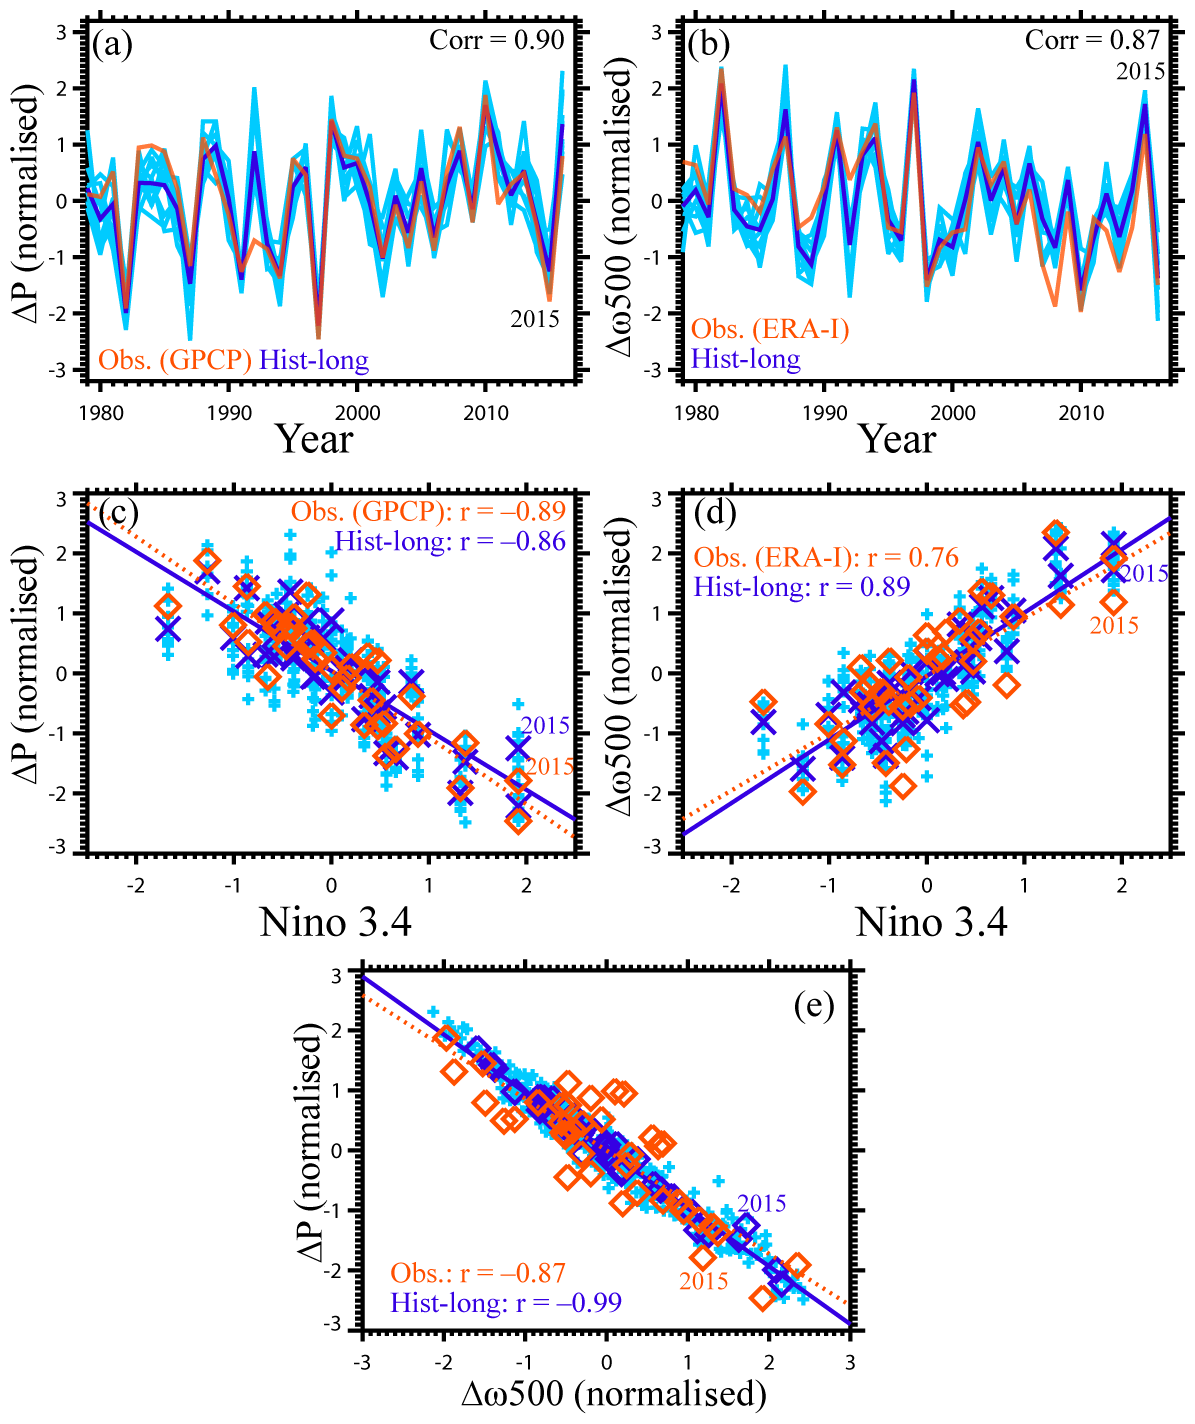
Figure 3Evaluations of the MIROC5 simulations of the EA-averaged precipitation and vertical air motions. Panels (a) and (b) show the normalised June–November mean time series of (a) ΔP (no unit) and (b) Δω500 (no unit). Red lines are the observations. Light blue lines are the 10 ensemble members of Hist-long, and blue lines are the ensemble mean. The other panels are scatter plots of (c) ΔP and the Niño 3.4 index (∘C), (d) Δω500 and the Niño 3.4 index, and (e) ΔP and Δω500. Red diamonds are the observed values. Small light-blue crosses are the 10 ensemble members of Hist-long, and large blue diamonds indicate the ensemble mean values. The red and blue lines indicate the regression lines of the observations and the ensemble averages of Hist-long, respectively.
To investigate whether historical anthropogenic climate change affected the precipitation anomalies during the 2015 El Niño event, we analyse the outputs of two large ensembles, one with factual historical forcing (Hist) and one with counterfactual natural forcing (Nat) of MIROC5 for June–November 2015 (Shiogama et al., 2013, 2014). These simulations are called probabilistic event attribution experiments, and they contribute to the international Climate and Ocean: Variability, Predictability and Change (CLIVAR) C20C+ Detection and Attribution project (Stone et al., 2019). The Hist ensemble is forced by historical anthropogenic and natural external forcing factors and also observational data of SST and sea ice (HadISST, Rayner et al., 2003). The Nat ensemble is forced by historical natural forcing factors and hypothetical “natural” SST and sea ice patterns where long-term anthropogenic signals were removed. Anthropogenic SST changes were estimated by taking the ensemble mean differences between the all-forcing historical runs and the natural-forcing historical runs of the CMIP5 AOGCMs. The multimodel averaged anthropogenic signal was subtracted from the HadISST data, and the Nat sea ice was estimated by using an empirical function that computes observed sea ice concentrations from surface temperature (Stone et al., 2019). Please note that both the Hist and Nat ensembles have 2015 El Niño components in the spatial patterns of SST, but the prescribed long-term warming anomalies in SST are different from each other. We performed 100-member runs of the 2006–2016 period for both Hist and Nat. Please see Shiogama et al. (2013, 2014) and Stone et al. (2019) for details regarding the experimental design.
We also analyse the 100-member ensembles of 11-year simulations with 1.5 and 2.0 ∘C warming relative to pre-industrial levels. We performed those experiments as a contribution to the HAPPI project (Mitchell et al., 2016, 2017, 2018; Shiogama et al., 2019). Since the ensemble-averaged global warming of the CMIP5 Representative Concentration Pathway 2.6 (RCP2.6) experiments is 1.55 ∘C, for the 1.5 ∘C runs, we used the RCP2.6 anthropogenic forcing agents (e.g. greenhouse gases) in 2095 and the ensemble mean 2091–2100 averaged SST anomalies of the RCP2.6 runs of the CMIP5 AOGCMs. The SST anomalies (Supplement Fig. S2, top panel) are changes in the CMIP5 multimodel mean SST for each month, between the decadal average of 2091–2100 RCP2.6 and the decadal average of 2006–2015 RCP8.5. We added those SST anomalies to the 2006–2016 observed SST data of HadISST. To estimate the sea ice concentration, we applied a linear sea ice–SST relationship estimated from observations (Supplement Figs. S3–S4) (Mitchell et al., 2017). For the 2.0 ∘C runs, we used the weighted sum of RCP2.6 and RCP4.5 () of the well-mixed greenhouse gas concentrations in 2095 and the ensemble mean 2091–2100 averaged SST anomalies of the CMIP5 AOGCM ensembles (Supplement Fig. S2, middle panel) because the weighted sum of the global mean temperature change values of the ensemble-averaged CMIP5 RCP2.6 and RCP4.5 runs is 2.0 ∘C. Please see Mitchell et al. (2017) for details regarding the experimental design. Notably, these future simulations have the same components as the 2015 El Niño event in terms of the spatial patterns of SST, but the prescribed long-term warming anomalies in SST have been added. Therefore, we can investigate drought events when events like the 2015 El Niño occur in 1.5 and 2.0 ∘C warmed climates relative to pre-industrial levels.
Furthermore, we run the 100-member 3.0 ∘C ensemble (10-year simulations based on the 2006–2015 HadISST data) as an extension of the HAPPI project. Following the original HAPPI methodology, we add SST and sea ice concentration anomalies that represent additional warming in a 3 ∘C warmer world compared to pre-industrial values. The SST anomalies (Supplement Fig. S2, bottom panel) are changes in the CMIP5 multimodel mean SST for the decadal average of 2006–2015 in RCP8.5 and the decadal average of 2091–2100 in a combined scenario of RCP4.5 and RCP8.5, i.e. (Lo et al., 2019). The CMIP5 multimodel global mean temperature in 2091–2100 is approximately 3 ∘C warmer than the 1861–1880 mean in this combined scenario; hence, this scenario describes 3 ∘C global warming above pre-industrial levels. For the sea ice concentration anomalies, we find the coefficients of this linear relationship from pre-existing 1.5 and 2 ∘C SST and sea ice anomalies. We apply this relationship to the 3 ∘C SST anomalies to estimate the sea ice concentration anomalies, which are then added to the observed 2006–2015 data (see Mitchell et al., 2017). Supplement Figs. S3–S4 show the sea ice concentrations in both hemispheres in the 1.5, 2 and 3 ∘C experiments. The same weightings for RCP4.5 and RCP8.5 in the combined scenario equivalent to 3 ∘C warming are also applied to greenhouse gas concentrations. This study is the first to report results from the HAPPI extension (i.e. the 3 ∘C runs) using MIROC5.
To compute the normalised values of EA-averaged ΔP and Δω500 of the Hist, Nat, 1.5, 2.0 and 3.0 ∘C runs, we subtract a long-term mean value of a given single member of Hist-long and divide anomalies by the standard deviation value of that Hist-long member. This normalisation process enables us to produce samples of normalised ΔP and Δω500 data for each of the Hist, Nat, 1.5, 2.0 and 3.0 ∘C ensembles.
The difference patterns of surface air temperature (≈ prescribed SST difference patterns over the ocean) in Hist–Nat and 1.5 ∘C–Nat, 2.0 ∘C–Nat and 3.0 ∘C–Nat have greater warming in the Niño 3.4 region than the tropical (30∘ S–30∘ N) ocean average values (Fig. 4). The relatively higher warming in the Niño 3.4 region accompanies downward motion anomalies in the EA region (Fig. 5a), enhancing negative precipitation anomalies when an El Niño occurs (Fig. 5b). Notably, the prescribed SST difference between the Niño 3.4 region and the tropical ocean mean is larger in the 1.5 ∘C runs than in the 2.0 ∘C runs. As a result, the amplitude of negative precipitation in the 1.5 ∘C runs is slightly greater than that in the 2.0 ∘C runs, as mentioned below, at least in these ensembles. It is not clear why the ensemble average of the CMIP5 RCP2.6 runs (i.e. the prescribed SST anomalies of the 1.5 ∘C runs) has a larger SST difference between the Niño 3.4 region and the tropical ocean mean than that of the weighted sum of RCP2.6 and RCP4.5 (the 2.0 ∘C runs).

Figure 4Surface air temperature warming patterns in 2015. (a) ΔT differences between 3.0 ∘C and Nat (∘C). The 30∘ S–30∘ N ocean averaged value is subtracted. The black box indicates the Niño 3.4 region. The other panels are the same as panel (a) but for (b) 2.0 ∘C and Nat, (c) 1.5 ∘C and Nat and (d) Hist and Nat.
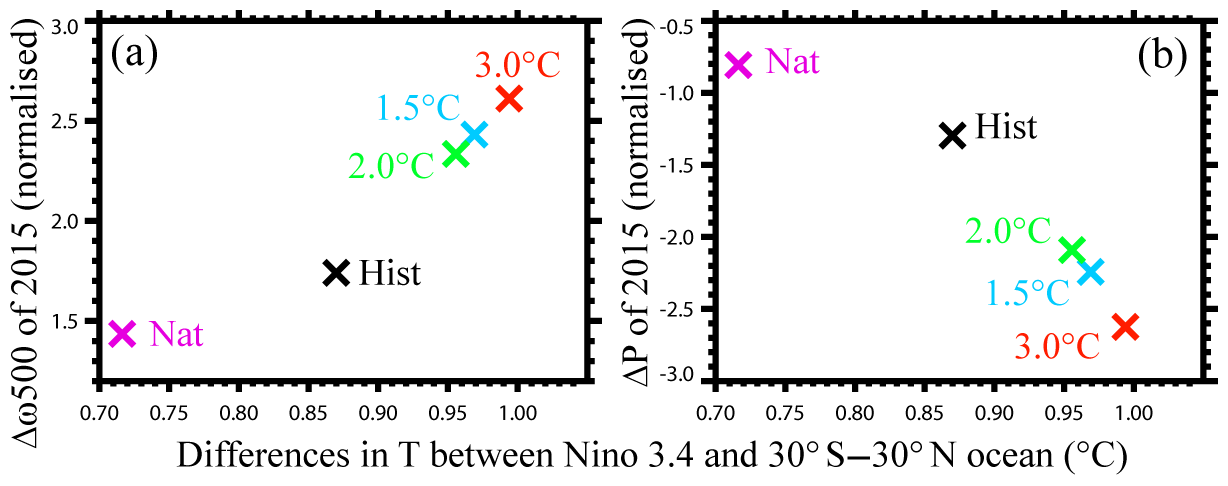
Figure 5Relationships between Niño 3.4 warming and EA vertical motion and precipitation anomalies of the ensemble mean. The horizonal axes show differences in the 2015 T anomalies between the Niño 3.4 area and the 30∘ S–30∘ N ocean (∘C). The vertical axes are (a) Δω500 (no unit) and (b) ΔP (no unit) for the year 2015. Crosses denote the ensemble averages of Nat (purple), Hist (black), 1.5 ∘C (light blue), 2.0 ∘C (green) and 3.0 ∘C (red).
The 10-member ensembles of Lestari et al. (2014) were too small to estimate probabilities of droughts. Our large ensemble simulations enable us to estimate the probabilities of drought exceeding the observed value. Historical anthropogenic climate change has significantly increased the chance of ΔP being more negative than the observed value from 2 % (1 %–4 %) in Nat to 9 % (6 %–14 %) in Hist (Fig. 6a). Here, we use the cumulative histograms of samples of ΔP to estimate the probabilities of ΔP. The values in parentheses indicate the 10 %–90 % confidence interval estimated by applying the 1000-time resampling: we randomly resample 100×10 data from the original 100×10 samples of ΔP and compute the probabilities of drought exceeding the 2015 observed value; we repeat the random resampling process 1000 times and consider the 10th percentile and 90th percentile values of the 1000 estimates of probability as the 10 %–90 % bounds. Even if the 1.5 and 2.0 ∘C goals of the Paris Agreement are achieved (in the 1.5 and 2.0 ∘C runs), the chance of exceeding the observed value significantly increases from 9 % (6 %–14 %) in Hist to 82 % (76 %–87 %) and 67 % (60 %–74 %), respectively. In the current trajectory of 3.0 ∘C warming (in the 3.0 ∘C runs), the chance of exceeding the observed value becomes 93 % (89 %–96 %).
By combining the ΔP of MIROC5 (Fig. 6a) and the empirical relationships in Fig. 2, we assess the historical and future changes in burned areas and fire emissions of CO2 and PM2.5 (Fig. 6b–d). We consider uncertainties by combining randomly resampled ΔP and resampled regression factors of Eq. (1): (i) we compute the regression factors of Eq. (1) using randomly resampled data (the same as the process used to estimate the uncertainty ranges of the regression lines); (ii) we randomly resample 100×10 data from the original 100×10 samples of ΔP; (iii) we use the regression factors of (i) and the 100×10 ΔP samples of (ii) to compute the 1000 estimates of fire or emissions and estimate the probability of exceeding the observed values; (iv) the processes of (i)–(iii) are repeated 1000 times; and (v) the 10th percentile and 90th percentile values of the 1000 estimates of the probabilities of exceeding the observed values are considered to be the 10 %–90 % bounds. Historical anthropogenic drying has increased the probability of exceeding the observed values of the burned area (from 5 % (0 %–18 %) to 23 % (3 %–52 %)), CO2 emissions (from 5 % (0 %–15 %) to 23 % (3 %–47 %)), and PM2.5 emissions (from 2 % (0 %–5 %) to 24 % (3 %–49 %)), but these changes are not statistically significant due to the large uncertainties. In the 1.5, 2.0 and 3.0 ∘C runs, the chances of exceeding the observed values significantly increase for the burned area (93 % (66 %–99 %), 81 % (50 %–95 %), and 98 % (84 %–100 %), respectively); for CO2 emissions (92 % (72 %–98 %), 81 % (55 %–93 %), and 98 % (86 %–100 %), respectively); and for PM2.5 emissions (93 % (70 %–98 %), 81 % (54 %–94 %), and 98 % (85 %–100 %), respectively).

Figure 6Changes in the cumulative probability functions. (a) The vertical axis indicates the probability (%) of ΔP being lower than a given horizontal value (no unit). Solid lines denote the 50 % values of the 1000 random samples of the Nat (purple), Hist (black), 1.5 ∘C (light blue), 2.0 ∘C (green) and 3.0 ∘C (red) ensembles. The vertical dotted line is the observed 2015 value. The other panels show the probabilities of exceeding the given horizontal values for (b) the burned area (km2), (c) CO2 emissions (TgCO2) and (d) PM2.5 emissions (t).
We contextualise the estimated fire CO2 emissions within the future emissions scenarios. Although the above analyses focus on the year when the 2015-like El Niño events occurred, long-term mean fire CO2 emissions are also important for mitigation policies. Here, we use the simulated June–November mean precipitation anomalies of 11 years (2006–2016), instead of using only the 2015 data, and the empirical function of Fig. 2b to estimate the cumulative probability function of fire CO2 emissions in the EA area in the 2.0 ∘C runs (Fig. 7). The fire CO2 emissions of the 11-year period including both El Niño and non-El Niño years (Fig. 7) are much less than those in the year 2015 with the major El Niño (Fig. 6c) due to low fire CO2 emissions in the non-El Niño years (Fig. 2). However, these fire CO2 emissions can have substantial implications for mitigation policies. The vertical lines in Fig. 7 are land-use CO2 emission scenarios for the year 2100 including fire emissions for the east and south-east Asia regions except China and Japan in the five shared socioeconomic pathway (SSP) scenarios from the Asia–Pacific Integrated Model/Computable General Equilibrium (AIM/CGE) (Fujimori et al., 2012). AIM/CGE is one of the integrated assessment models (economic models) that produced the emissions data of SSP scenarios for the Coupled Model Intercomparison Project Phase 6 and the sixth assessment report of the Intergovernmental Panel on Climate Change (Riahi et al., 2017; Fujimori et al., 2017). Please note that land-use CO2 emissions for the year 2100 are not linearly related to the SSP numbers because the SSP numbers did not indicate radiative forcing levels. The chances of exceeding the emissions of SSP1, 2, 3, 4 and 5 are 77 % (70 %–84 %), 34 % (28 %–39 %), 13 % (10 %–18 %), 37 % (31 %–41 %), and 77 % (70 %–84 %), respectively. Although these probability values highly depend on the SSP scenarios, the results are substantial in all the SSP scenarios. Because the CO2 emissions in the AIM/CGE model include a wider area and emission sources other than the EA fire emissions of CO2, this comparison is conservative. In the SSP simulations of AIM/CGE, fire CO2 emissions are computed by using functions of land-cover changes, and climate change effects on fires are not considered. Therefore, it is suggested that implementing climate change effects on fire CO2 emissions in integrated assessment models can significantly affect SSP land-use CO2 emissions and studies on mitigation pathways, which in turn would be highly relevant to national and global climate policies. We suggest that additional fire CO2 emissions due to climate change should be considered in possible CMIP7 activities.

Figure 7The red curves are the cumulative probability function of CO2 emissions (TgCO2 yr−1) in June–November of 2006–2016 for the 2.0 ∘C runs. Solid and dashed lines denote the 50 % values and the 10 %–90 % confidence intervals, respectively. The vertical lines indicate annual land-use CO2 emission scenarios for the year 2100 (including fire emissions of CO2) for the east and south-east Asia regions, except China and Japan, for the five SSP baseline scenarios of the AIM/CGE model.
By applying the probabilistic event attribution approach based on the MIROC5 AGCM ensembles, we suggested that historical anthropogenic warming significantly increased the chances of severe meteorological drought exceeding the 2015 observations in the EA area during the 2015 major El Niño event (from 2 % (1 %–4 %) in Nat to 9 % (6 %–14 %) in Hist). By performing and analysing the HAPPI (1.5 and 2.0 ∘C warming) and HAPPI extension (3.0 ∘C warming) runs, we showed that the probabilities of drought exceeding the 2015 observations will largely increase: 82 % (76 %–87 %), 67 % (60 %–74 %), and 93 % (89 %–96 %), respectively.
Drying trends tend to exacerbate fire activity. By combining these experiments and the empirical functions, we also implied that historical anthropogenic drying had tended to increase the chances of the burned area, CO2 emissions and PM2.5 emissions exceeding the 2015 observations, but those changes were not statistically significant. In contrast, if the 2.0 ∘C goal is achieved, the chances of exceeding the observed values will substantially increase for the burned area from 23 % (3 %–52 %) in Hist to 81 % (50 %–95 %) for 2.0 ∘C, CO2 emissions from 23 % (3 %–47 %) to 81 % (55 %–93 %), and PM2.5 emissions from 24 % (3 %–49 %) to 81 % (54 %–94 %). These results agree well with Lestari et al. (2014) and Yin et al. (2016), who showed that the AOGCM ensemble of CMIP5 projected future long-term trends of drying and enhanced fire CO2 emissions. We further suggest that the risks of drought and fire significantly increase when events like the 2015 El Niño occur in future warmer climates even if the 1.5 and 2.0 ∘C goals are achieved. The impacts of these changes on droughts, burned areas and fire emissions should be reduced by adaptation investments.
If we cannot limit global warming to 2.0 ∘C and it reaches 3.0 ∘C as expected from the current emissions gap (United Nations Environment Programme, 2018), the chances of exceeding the observed values further increase for the burned area, CO2 emissions and PM2.5 emissions. Although the differences between 2.0 and 3.0 ∘C are not statistically significant for the burned area and the CO2 and PM2.5 emissions, the 50th percentile values of probabilities exceeding the 2015 observations first reach approximately 100 % in the 3.0 ∘C runs. These additional changes relative to 2.0 ∘C indicate the effects of the failures of mitigation policies. Conversely, these changes indicate the potential benefits of limiting the current trajectory of 3 ∘C global warming to the Paris Agreement goals.
Forest-based climate mitigation has a key role in meeting the goals of the Paris Agreement (Grassi et al., 2017). We also suggested that changes in fire CO2 emissions due to future warming can increase the need for modifying fire CO2 emission scenarios for future climate projections. Although we focused on the influences of climate change on burned area and fire emissions, land-use and land-cover changes are also important factors. To avoid fire intensification due to drying climates, effective land management policies for protecting forests and peatlands are necessary (Marlier et al., 2015; Kim et al., 2015; Koplitz et al., 2016; World Bank, 2016).
This study is based on the single model ensembles using particular SST anomaly patterns. A future work to compare multimodel simulations using multiple estimates of warming patterns in SST would be useful.
The data from the MIROC5 model, ERA-I, GPCP and GFED4s used in this article can be downloaded from https://portal.nersc.gov/cascade/data/downloader.php?get_dirs= (C20C+ Detection and Attribution Project, 2020), https://www.ecmwf.int/en/forecasts/datasets/reanalysis-datasets/era-interim (ECMWF, 2020), https://www.esrl.noaa.gov/psd/data/gridded/data.gpcp.html (NOAA/ESRL/PSL, 2020), and https://www.globalfiredata.org/data.html (GFED, 2020), respectively. The data of AIM/CGE can be accessed by contacting the corresponding author.
The supplement related to this article is available online at: https://doi.org/10.5194/esd-11-435-2020-supplement.
HS, RH, TH, SF and SC designed the analysis. HS performed the analysis and wrote the first draft of the paper. HS, YTEL and DM proposed and performed the HAPPI extension runs. All authors contributed to the interpretation of the results and to the writing of the paper.
The authors declare that they have no conflict of interest.
This article is part of the special issue “Large Ensemble Climate Model Simulations: Exploring Natural Variability, Change Signals and Impacts”. It is not associated with a conference.
We thank the reviewers and the editor for their useful comments. The MIROC5 simulations were performed using the Earth Simulator at JAMSTEC and the NEC SX at NIES.
This research has been supported by ERTDF 2-1702 (Environmental Restoration and Conservation Agency, Japan), the Integrated Research Program for Advancing Climate Models (TOUGOU, grant no. JPMXD0717935457) and the Climate Change Adaptation research programmes of NIES. This research used the science gateway resources of the National Energy Research Scientific Computing Center, a DOE Office of Science User Facility supported by the Office of Science of the U.S. Department of Energy under contract no. DE-AC02-05CH11231.
This paper was edited by Nicola Maher and reviewed by three anonymous referees.
Adler, R. F., Huffman, G. J., Chang, A., Ferraro, R., Xie, P.-P., Janowiak, J., Rudolf, B., Schneider, U., Curtis, S., Bolvin, D., Gruber, A., Susskind, J., Arkin, P., and Nelkin, E.: The Version-2 Global Precipitation Climatology Project (GPCP) Monthly Precipitation Analysis (1979–Present), J. Hydrometeorol., 4, 1147–1167, https://doi.org/10.1175/1525-7541(2003)004<1147:TVGPCP>2.0.CO;2, 2003.
Allen, M. R.: Liability for climate change. Nature, 421, 891–892, 2003.
Baccini, A., Goetz, S. J., Walker, W. S., Laporte, N. T., Sun, M., Sulla-Menashe, D., Hackler, J., Beck, P. S. A., Dubayah, R., Friedl, M. A., Samanta, S., and Houghton, R. A.: Estimated carbon dioxide emissions from tropical deforestation improved by carbon-density maps, Nature Clim. Change, 2, 182–185, 2012.
Baccini, A., Walker, W., Carvalho, L., Farina, M., Sulla-Menashe, D., and Houghton, R. A.: Tropical forests are a net carbon source based on aboveground measurements of gain and loss, Science, 358, 230–233, 2017.
C20C+ Detection and Attribution Project: CASCADE REMOTE DOWNLOADER, available at: https://portal.nersc.gov/cascade/data/downloader.php?get_dirs=, last access: 13 May 2020.
Dee, D. P., Uppala, S. M., Simmons, A. J., Berrisford, P., Poli, P., Kobayashi, S., Andrae, U., Balmaseda, M. A., Balsamo, G., Bauer, P., Bechtold, P., Beljaars, A. C. M., van de Berg, L., Bidlot, J., Bormann, N., Delsol, C., Dragani, R., Fuentes, M., Geer, A. J., Haimberger, L., Healy, S. B., Hersbach, H., Hólm, E. V., Isaksen, L., Kållberg, P., Köhler, M., Matricardi, M., Mcnally, A. P., Monge-Sanz, B. M., Morcrette, J. J., Park, B. K., Peubey, C., de Rosnay, P., Tavolato, C., Thépaut, J. N., and Vitart, F.: The ERA-Interim reanalysis: Configuration and performance of the data assimilation system, Q. J. Roy. Meteorol. Soc., 137, 553–597, https://doi.org/10.1002/qj.828, 2011.
ECMWF: ERA-Interim, available at: https://www.ecmwf.int/en/forecasts/datasets/reanalysis-datasets/era-interim, last access: 12 May 2020.
Field, R. D., van der Werf, G. R., Fanin, T., Fetzer, E. J., Fuller, R., Jethva, H., Levy, R., Livesey, N. J., Luo, M., Torres, O., and Worden, H. M.: Indonesian fire activity and smoke pollution in 2015 show persistent nonlinear sensitivity to El Niño-induced drought, P. Natl. Acad. Sci., 113, 9204–9209, https://doi.org/10.1073/pnas.1524888113, 2016.
Fujimori, S., Masui, T., and Matsuoka, Y.: AIM/CGE [basic] manual, Center for Social and Environmental Systems Research, NIES, Tsukuba, Japan, 2012.
Fujimori, S., Hasegawa, T., Masui, T., Takahashi, K., Herran, D. S., Dai, H., Hijioka, Y., and Kainuma, M.: SSP3: AIM implementation of Shared Socioeconomic Pathways, Glob. Environ. Chang., 42, 268–283, https://doi.org/10.1016/j.gloenvcha.2016.06.009, 2017.
GFED: GFED Data, available at: https://www.globalfiredata.org/data.html, last access: 13 May 2020.
Grassi, G., House, J., Dentener, F., Federici, S., Den Elzen, M., and Penman, J.: The key role of forests in meeting climate targets requires science for credible mitigation, Nat. Clim. Chang., 7, 220–226, https://doi.org/10.1038/nclimate3227, 2017.
Hartmann, F., Merten, J., Fink, M., and Faust, H.: Indonesia's Fire Crisis 2015: A Twofold Perturbation on the Ground, Pacific Geographies, 49, 4–11, https://doi.org/10.23791/490411, 2018.
Hirota, N., Ogura, T., Tatebe, H., Shiogama, H., Kimoto, M., and Watanabe, M.: Roles of shallow convective moistening in the eastward propagation of the MJO in MIROC6, J. Clim., 31, 3033–3047, https://doi.org/10.1175/JCLI-D-17-0246.1, 2018.
Kim, P. S., Jacob, D. J., Mickley, L. J., Koplitz, S. N., Marlier, M. E., DeFries, R. S., Myers, S. S., Chew, B. N., and Mao, Y. H.: Sensitivity of population smoke exposure to fire locations in Equatorial Asia, Atmos. Environ., 102, 11–17, https://doi.org/10.1016/j.atmosenv.2014.09.045, 2015.
Kim, Y. H., Min, S. K., Stone, D. A., Shiogama, H., and Wolski, P.: Multi-model event attribution of the summer 2013 heat wave in Korea, Weather Clim. Extrem., 20, 33–44, https://doi.org/10.1016/j.wace.2018.03.004, 2018.
Koplitz, S. N., Mickley, L. J., Marlier, M. E., Buonocore, J. J., Kim, P. S., Liu, T., Sulprizio, M. P., DeFries, R. S., Jacob, D. J., Schwartz, J., Pongsiri, M., and Myers, S. S.: Public health impacts of the severe haze in Equatorial Asia in September-October 2015: Demonstration of a new framework for informing fire management strategies to reduce downwind smoke exposure, Environ. Res. Lett., 11, 094023, https://doi.org/10.1088/1748-9326/11/9/094023, 2016.
Lestari, R. K., Watanabe, M., Imada, Y., Shiogama, H., Field, R. D., Takemura, T., and Kimoto, M.: Increasing potential of biomass burning over Sumatra, Indonesia induced by anthropogenic tropical warming, Environ. Res. Lett., 9, 104010, https://doi.org/10.1088/1748-9326/9/10/104010, 2014.
Liu, J., Bowman, K., Schimel, D., Parazoo, N., Jiang, Z., Lee, M., Bloom, A., Wunch, D., Gurney, K. R., Menemenlis, D., Girerach, M., Crisp, D., and Eldering, A.: Contrasting carbon cycle responses of the tropical continents to the 2015–2016 El Niño, Science, 358, eaam5690, https://doi.org/10.1126/science, 2017.
Liu, W., Sun, F., Lim, W. H., Zhang, J., Wang, H., Shiogama, H., and Zhang, Y.: Global drought and severe drought-affected populations in 1.5 and 2 ∘C warmer worlds, Earth Syst. Dynam., 9, 267–283, https://doi.org/10.5194/esd-9-267-2018, 2018.
Lo, Y. T. E, Mitchell, D. M., Gasparrini, A., Vicedo-Cabrera, A. M., Ebi, K. L., Frumhoff, P. C., Millar, R. J., Roberts, W., Sera, F., Sparrow, S., Uhe, P., and Williams, G.: Increasing mitigation ambition to meet the Paris Agreement's temperature goal avoids substantial heat-related mortality in U.S. cities, Sci. Adv., 5, eaau4373, https://doi.org/10.1126/sciadv.aau4373, 2019.
Marlier, M. E., Defries, R. S., Voulgarakis, A., Kinney, P. L., Randerson, J. T., Shindell, D. T., Chen, Y., and Faluvegi, G.: El Niño and health risks from landscape fire emissions in southeast Asia, Nat. Clim. Chang., 3, 131–136, https://doi.org/10.1038/nclimate1658, 2013.
Marlier, M. E., Defries, R. S., Kim, P. S., Gaveau, D. L. A., Koplitz, S. N., Jacob, D. J., Mickley, L. J., Margono, B. A., and Myers, S. S.: Regional air quality impacts of future fire emissions in Sumatra and Kalimantan, Environ. Res. Lett., 10, 054010, https://doi.org/10.1088/1748-9326/10/5/054010, 2015.
Mitchell, D., James, R., Forster, P. M., Betts, R. A., Shiogama, H., and Allen, M.: Realizing the impacts of a 1.5 ∘C warmer world, Nat. Clim. Chang., 6, 735–737, https://doi.org/10.1038/nclimate3055, 2016.
Mitchell, D., AchutaRao, K., Allen, M., Bethke, I., Beyerle, U., Ciavarella, A., Forster, P. M., Fuglestvedt, J., Gillett, N., Haustein, K., Ingram, W., Iversen, T., Kharin, V., Klingaman, N., Massey, N., Fischer, E., Schleussner, C.-F., Scinocca, J., Seland, Ø., Shiogama, H., Shuckburgh, E., Sparrow, S., Stone, D., Uhe, P., Wallom, D., Wehner, M., and Zaaboul, R.: Half a degree additional warming, prognosis and projected impacts (HAPPI): background and experimental design, Geosci. Model Dev., 10, 571–583, https://doi.org/10.5194/gmd-10-571-2017, 2017.
Mitchell, D., Heaviside, C., Schaller, N., Allen, M., Ebi, K. L., Fischer, E. M., Gasparrini, A., Harrington, L., Kharin, V., Shiogama, H., Sillmann, J., Sippel, S., and Vardoulakis, S.: Extreme heat-related mortality avoided under Paris Agreement goals, Nat. Clim. Chang., 8, 551–553, https://doi.org/10.1038/s41558-018-0210-1, 2018.
NOAA/ESRL/PSL: GPCP Version 2.3 Combined Precipitation Data Set, available at: https://www.esrl.noaa.gov/psd/data/gridded/data.gpcp.html, last access: 13 May 2020.
Page, S. E., Rieley, J. O., and Banks C. J.: Global and regional importance of the tropical peatland carbon pool, Glob. Change Biol., 17, 798–818, 2011.
Pall, P., Aina, T., Stone, D. A., Stott, P. A., Nozawa, T., Hilberts, A. G. J., Lohmann, D., and Allen, M. R.: Anthropogenic greenhouse gas contribution to flood risk in England and Wales in autumn 2000, Nature, 470, 382–385, 2011.
Rayner, N. A., Parker, D. E., Horton, E. B., Folland, C. K., Alexander, L. V., Rowell, D. P., Kent, E. C., and Kaplan, A.: Global analyses of sea surface temperature, sea ice, and night marine air temperature since the late nineteenth century, J. Geophys. Res., 108, 4407, https://doi.org/10.1029/2002JD002670, 2003.
Riahi, K., van Vuuren, D. P., Kriegler, E., Edmonds, J., O'Neill, B. C., Fujimori, S., Bauer, N., Calvin, K., Dellink, R., Fricko, O., Lutz, W., Popp, A., Cuaresma, J. C., Samir, K. C., Leimbach, M., Jiang, L., Kram, T., Rao, S., Emmerling, J., Ebi, K., Hasegawa, T., Havlik, P., Humpenöder, F., Da Silva, L. A., Smith, S., Stehfest, E., Bosetti, V., Eom, J., Gernaat, D., Masui, T., Rogelj, J., Strefler, J., Drouet, L., Krey, V., Luderer, G., Harmsen, M., Takahashi, K., Baumstark, L., Doelman, J. C., Kainuma, M., Klimont, Z., Marangoni, G., Lotze-Campen, H., Obersteiner, M., Tabeau, A., and Tavoni, M.: The Shared Socioeconomic Pathways and their energy, land use, and greenhouse gas emissions implications: An overview, Glob. Environ. Chang., 42, 153–168, https://doi.org/10.1016/j.gloenvcha.2016.05.009, 2017.
Saatchi, S. S., Harris, N. L., Brown, S., Lefsky, M., Mitchard, E. T., Salas, W., Zuttaa, B. R., Buermann, W., Lewis, S. L., Hagen, S., Petrova, S., White, L., Silman, M., and Morel, A.: Benchmark map of forest carbon stocks in tropical regions across three continents, P. Natl. Acad. Sci. USA, 108, 9899–9904, 2011.
Saeed, F., Bethke, I., Fischer, E., Legutke, S., Shiogama, H., Stone, D. A., and Schleussner, C. F.: Robust changes in tropical rainy season length at 1.5 ∘C and 2 ∘C, Environ. Res. Lett., 13, 064024, https://doi.org/10.1088/1748-9326/aab797, 2018.
Santoso, A., Mcphaden, M. J., and Cai, W.: The defining characteristics of ENSO extremes and the strong 2015/2016 El Niño, Rev. Geophys., 55, 1079–1129, https://doi.org/10.1002/2017RG000560, 2017.
Shiogama, H., Watanabe, M., Imada, Y., Mori, M., Ishii, M., and Kimoto, M.: An event attribution of the 2010 drought in the South Amazon region using the MIROC5 model, Atmos. Sci. Lett., 14, 170–175, https://doi.org/10.1002/asl2.435, 2013.
Shiogama, H., Watanabe, M., Imada, Y., Mori, M., Kamae, Y., Ishii, M., and Kimoto, M.: Attribution of the June–July 2013 heat wave in the southwestern United States, SOLA, 10, 122–126, https://doi.org/10.2151/sola.2014-025, 2014.
Shiogama, H., Hasegawa, T., Fujimori, S., Murakami, D., Takahashi, K., Tanaka, K., Emori, S., Kubota, I., Abe, M., Imada, Y., Watanabe, M., Mitchell, D., Schaller, N., Sillmann, J., Fischer, E., Scinocca, J. F., Bethke, I., Lierhammer, L., Takakura, J., Trautmann, T., Döll, P., Ostberg, S., Schmied, H. M., Saeed, F., and Schleussner, C.-F.: Limiting global warming to 1.5 ∘C will lower increases in inequalities of four hazard indicators of climate change, Environ. Res. Lett., 14, 124022, https://doi.org/10.1088/1748-9326/ab5256, 2019.
Spessa, A. C., Field, R. D., Pappenberger, F., Langner, A., Englhart, S., Weber, U., Stockdale, T., Siegert, F., Kaiser, J. W., and Moore, J.: Seasonal forecasting of fire over Kalimantan, Indonesia, Nat. Hazards Earth Syst. Sci., 15, 429–442, https://doi.org/10.5194/nhess-15-429-2015, 2015.
Stockwell, C. E., Jayarathne, T., Cochrane, M. A., Ryan, K. C., Putra, E. I., Saharjo, B. H., Nurhayati, A. D., Albar, I., Blake, D. R., Simpson, I. J., Stone, E. A., and Yokelson, R. J.: Field measurements of trace gases and aerosols emitted by peat fires in Central Kalimantan, Indonesia, during the 2015 El Niño, Atmos. Chem. Phys., 16, 11711–11732, https://doi.org/10.5194/acp-16-11711-2016, 2016.
Stone, D. A., Christidis, N., Folland, C., Perkins-Kirkpatrick, S., Perlwitz, J., Shiogama, H., Wehner, M. F., Wolski, P., Cholia, S., Krishnan, H., Murray, D., Angélil, O., Beyerle, U., Ciavarella, A., Dittus, A., Quan, X. W., and Tadross, M.: Experiment design of the International CLIVAR C20C+ Detection and Attribution project, Weather Clim. Extrem., 24, 100206, https://doi.org/10.1016/j.wace.2019.100206, 2019.
Taufik, M., Torfs, P. J. J. F., Uijlenhoet, R., Jones, P. D., Murdiyarso, D., and Van Lanen, H. A. J.: Amplification of wildfire area burnt by hydrological drought in the humid tropics, Nat. Clim. Chang., 7, 428–431, https://doi.org/10.1038/nclimate3280, 2017.
Taylor, K. E., Stouffer, R. J., and Meehl, G. A.: An Overview of CMIP5 and Experimental Design, B. Am. Meteorol. Soc., 93, 485–498, https://doi.org/10.1175/BAMS-D-11-00094.1, 2012.
United Nations Environment Programme: Emissions Gap Report 2018, 2018.
United Nations Framework Convention on Climate Change: Adoption of the Paris Agreement FCCC/CP/2015/L.9/Rev.1, 2015.
van der Werf, G. R., Randerson, J. T., Giglio, L., van Leeuwen, T. T., Chen, Y., Rogers, B. M., Mu, M., van Marle, M. J. E., Morton, D. C., Collatz, G. J., Yokelson, R. J., and Kasibhatla, P. S.: Global fire emissions estimates during 1997–2016, Earth Syst. Sci. Data, 9, 697–720, https://doi.org/10.5194/essd-9-697-2017, 2017.
Watanabe, M., Suzuki, T., O'Ishi, R., Komuro, Y., Watanabe, S., Emori, S., Takemura, T., Chikira, M., Ogura, T., Sekiguchi, M., Takata, K., Yamazaki, D., Yokohata, T., Nozawa, T., Hasumi, H., Tatebe, H., and Kimoto, M.: Improved climate simulation by MIROC5: Mean states, variability, and climate sensitivity, J. Clim., 23, 6312–6335, https://doi.org/10.1175/2010JCLI3679.1, 2010.
Wehner, M., Stone, D., Mitchell, D., Shiogama, H., Fischer, E., Graff, L. S., Kharin, V. V., Lierhammer, L., Sanderson, B., and Krishnan, H.: Changes in extremely hot days under stabilized 1.5 and 2.0 °C global warming scenarios as simulated by the HAPPI multi-model ensemble, Earth Syst. Dynam., 9, 299–311, https://doi.org/10.5194/esd-9-299-2018, 2018.
World Bank: The cost of fire: an economic analysis of Indonesia's 2015 fire crisis (English). Indonesia sustainable landscapes knowledge; note no. 1. Washington, D.C., World Bank Group, 2016.
Yin, Y., Ciais, P., Chevallier, F., van der Werf, G. R., Fanin, T., Broquet, G., Boesch, H., Cozic, A., Hauglustaine, D., Szopa, S., and Wang, Y.: Variability of fire carbon emissions in equatorial Asia and its nonlinear sensitivity to El Niño, Geophys. Res. Lett., 43, 10472–10479, https://doi.org/10.1002/2016GL070971, 2016.
- Abstract
- Introduction
- Empirical functions
- Model simulations
- Changes in precipitation, burned area and fire emissions of CO2 and PM2.5
- Conclusions
- Data availability
- Author contributions
- Competing interests
- Special issue statement
- Acknowledgements
- Financial support
- Review statement
- References
- Supplement