the Creative Commons Attribution 4.0 License.
the Creative Commons Attribution 4.0 License.
 | 05 Dec 2019
Heat stress risk in European dairy cattle husbandry under different climate change scenarios – uncertainties and potential impacts
Christoph Menz
Severino Pinto
Elena Galán
David Janke
Fernando Estellés
Theresa Müschner-Siemens
Xiaoshuai Wang
Julia Heinicke
Guoqiang Zhang
Barbara Amon
Agustín del Prado
Thomas Amon
In the last decades, a global warming trend was observed. Along with the temperature increase, modifications in the humidity and wind regime amplify the regional and local impacts on livestock husbandry. Direct impacts include the occurrence of climatic stress conditions. In Europe, cows are economically highly relevant and are mainly kept in naturally ventilated buildings that are most susceptible to climate change. The high-yielding cows are particularly vulnerable to heat stress. Modifications in housing management are the main measures taken to improve the ability of livestock to cope with these conditions. Measures are typically taken in direct reaction to uncomfortable conditions instead of in anticipation of a long-term risk for climatic stress. Measures that balance welfare, environmental and economic issues are barely investigated in the context of climate change and are thus almost not available for commercial farms. Quantitative analysis of the climate change impacts on animal welfare and linked economic and environmental factors is rare.
Therefore, we used a numerical modeling approach to estimate the future heat stress risk in such dairy cattle husbandry systems. The indoor climate was monitored inside three reference barns in central Europe and the Mediterranean regions. An artificial neuronal network (ANN) was trained to relate the outdoor weather conditions provided by official meteorological weather stations to the measured indoor microclimate. Subsequently, this ANN model was driven by an ensemble of regional climate model projections with three different greenhouse gas concentration scenarios. For the evaluation of the heat stress risk, we considered the number and duration of heat stress events. Based on the changes in the heat stress events, various economic and environmental impacts were estimated.
The impacts of the projected increase in heat stress risk varied among the barns due to different locations and designs as well as the anticipated climate change (considering different climate models and future greenhouse gas concentrations). There was an overall increasing trend in number and duration of heat stress events. At the end of the century, the number of annual stress events can be expected to increase by up to 2000, while the average duration of the events increases by up to 22 h compared to the end of the last century. This implies strong impacts on economics, environment and animal welfare and an urgent need for mid-term adaptation strategies. We anticipated that up to one-tenth of all hours of a year, correspondingly one-third of all days, will be classified as critical heat stress conditions. Due to heat stress, milk yield may decrease by about 2.8 % relative to the present European milk yield, and farmers may expect financial losses in the summer season of about 5.4 % of their monthly income. In addition, an increasing demand for emission reduction measures must be expected, as an emission increase of about 16 Gg of ammonia and 0.1 Gg of methane per year can be expected under the anticipated heat stress conditions. The cattle respiration rate increases by up to 60 %, and the standing time may be prolonged by 1 h. This causes health issues and increases the probability of medical treatments.
The various impacts imply feedback loops in the climate system which are presently underexplored. Hence, future in-depth studies on the different impacts and adaptation options at different stress levels are highly recommended.


In the last decades, a continuation of the long-term global warming trend has been observed and regional and local impacts have already become apparent (WMO, 2018). These impacts are expected to become worse with ongoing climate change (Christensen et al., 2007; van Oldenborgh et al., 2013). For Europe, temperature increase is projected in all seasons (Kjellström et al., 2018). Regional climate models anticipate a strong warming in large parts of northeastern Europe that is particularly pronounced in winter. The strongest warming in summer is expected to be observed in southern and southwestern Europe. Along with the temperature increase, modifications in the humidity (precipitation) and wind regime are expected.
Seasonal shifts and changes in frequency and intensity of weather extremes will amplify the impacts in many economic sectors such as agriculture (Nardone et al., 2010). It is expected that approximately 26 % of all damages and losses associated with medium-to-large-scale climate-related disasters are attributed to agriculture with its sectors crops, livestock, fisheries, aquaculture and forestry (FAO, 2017). So far, many studies of climate change impacts on agricultural production have focused mainly on land use or crop yields (Olesen and Bindi, 2002; Kurukulasuriya and Rosenthal, 2013). Mechanisms of climatic effects on plants have been already implemented in numeric models decades ago such as the EPIC (Erosion-Productivity Impact Calculator) plant growth model or the WOFOST (WOrld FOod STudies) model (Williams et al., 1989; Diepen et al., 1989). The development of models for the livestock sector emerged in recent years and focused on field- and farm-scale models that map the interactions between farm components such as livestock, grassland, animal housing, manure storage and farm management (Hutchings et al., 1996; Del Prado et al., 2006). As a consequence, initiatives like AgMIP (https://agmip.org/, last access: 11 April 2019), ISIMIP (https://www.isimip.org/, last access: 11 April 2019) or MACSUR (https://www.macsur.eu/, last access: 11 April 2019) have many more contributions in the crop sector as compared to the livestock sector.
The topic of direct climate change impacts on livestock production is becoming more and more important due to the potential consequences of climatic stress (Vitt et al., 2017). Uncomfortable climatic conditions for farm animals impair animal growth; meat and milk yields and quality; egg yield, weight, and quality; reproductive performance; metabolic and health status; and immune response (Nardone et al., 2010; Brouček et al., 1991; Angrecka and Herbut, 2015). The term climatic stress (i.e., heat stress and cold stress) refers to any change to the bodies of farm animals when trying to adapt to changing meteorological conditions. This includes physiological and behavioral changes (Galán et al., 2018). It can be caused by any combination of air movement, temperature, humidity and radiant heat (Mader et al., 2006).
Breeding is one possibility to reduce the impacts of climatic stress (Hammami et al., 2014). However, climate change is a slow process, feedback mechanisms are not fully understood and there are contradictory aims (i.e., low heat stress susceptibility versus high yields) (Hoffmann, 2010). As a consequence, climate change adaptation or heat stress mitigation plays only a minor role in breeding strategies. Modifications in housing management are the main measures taken to improve the ability of livestock to cope with climatic stress conditions. Measures and systems for early warning and automatic adaptation that balance welfare, environmental and economic issues are, however, barely investigated in the context of climate change and are thus almost not available for commercial farms. In order to address this crucial and complex topic, inter- and transdisciplinary research is required, incorporating natural sciences, social sciences and engineering.
According to STATISTICA (http://de.statista.com/, last access: 10 September 2018), approximately 47×106 t of fresh dairy products are consumed annually in the European Union. In 2016, according to EUROSTAT (https://ec.europa.eu/eurostat/statistics-explained/index.php?title=Main_Page, last access: 10 September 2018), 168×106 t of milk was produced in the EU-28, nearly 97 % of which was from cattle. The large-scale farming of cattle is a hot topic in public discussions related to animal welfare and emissions (Steinfeld et al., 2013). High-yielding dairy cattle have a relatively narrow range of environmental conditions for optimal milk yield and milk quality (West, 2003; Kadzere et al., 2002). In this so-called thermoneutral zone (typically around 10 ∘C) the cattle do not suffer significantly from climatic stress (i.e., minimal physiological effort for adaptation), which has an added value to animal welfare and health. The thermal optimum is associated with minimal methane emissions (Hempel et al., 2016b). Depending on cow-specific factors, such as breed, age or productivity (milk yield), and the local environment in which the cows are adapted, the edges of the thermoneutral zone and the stress threshold differ (e.g., the optimum is considered to be at 5 or 15 ∘C) (Hahn, 1999; Kadzere et al., 2002; West, 2003; Brügemann et al., 2012; Heinicke et al., 2018). Potential stress indicators are changes in body temperature, respiration rate, milk yield, rumination activity or lying, and feeding and drinking behavior (Hempel et al., 2016a; Polsky and von Keyserlingk, 2017; Curtis et al., 2017; Heinicke et al., 2018).
High-yielding dairy cattle are particularly susceptible to heat stress. Hence, farmers are aware of the importance and benefits of a good ventilation system for removing excess moisture (about 600 g h−1 per cow) and heat (about 1500 W per cow) produced by the cows in order to minimize heat stress (Pedersen and Sällvik, 2002). There are in principle two options to achieve this: mechanical and natural ventilation, of which the latter is most typical for dairy cows across Europe, as well as in many other parts of the world (Queiroz et al., 2005; Samer et al., 2011). Despite some regional differences, all naturally ventilated barns have the energy-saving aspect in common since they do not require energy to constantly operate fans. However, they are most vulnerable to increased climate variability associated with climate change, since there is a lack of precise control of the air flow. A suitable location of the building with respect to prevailing winds and surrounding trees, structures and land formations is essential.
Altogether, this renders adaptation of dairy cattle husbandry to climate change particularly challenging and leads to various impacts not only on animal welfare but also on economics and the environment. The current design of naturally ventilated barns offers only limited regulation options which have been developed to fit to the local outdoor climate in specific regions. Adaptation involves mainly short-term strategies such as turning fans or sprinklers on or off depending on the predicted outdoor temperature. A sound prediction of the anticipated number and duration of heat stress events in naturally ventilated barns will be valuable for the farmers to schedule mid-term and optimize short-term adaptation strategies. Indoor climate modeling based on indoor measurements (together with knowledge of the range of uncertainties) can improve the assessment of future heat stress events and thus promote adaption of the husbandry system.
The interdisciplinary European project OptiBarn (http://www.optibarn.eu, last access: 11 April 2019; Hempel et al., 2017a, b, c) was designed to investigate adaptation needs and options for optimized animal-specific housing of European livestock under climate change. A modeling system was established in the project to link measurements and modeling of barn climate (natural sciences and engineering) and research on climate-induced behavioral and physiological changes at the barn scale (veterinary and agricultural sciences) with research on climate change and economic impacts at the farm scale. Important aspects in this context are the physiological needs of the housed livestock species as well as the regionally typical specifications of the housing.
Within the OptiBarn project, meteorological data were collected inside naturally ventilated barns together with physiological and behavioral data focusing on dairy cattle farming in three reference barns in central Europe and in the Mediterranean region in order to develop region-specific sustainable adaptation strategies for dairy housing. Here, this data set was used to investigate changes in the heat stress risk of dairy cattle housed in naturally ventilated barns. We hypothesize that the probability of the occurrence of critical indoor conditions depends on the barn concept and the outdoor climate conditions. The consequences for future heat stress risk were analyzed when considering different climate projections for different regions including the effect of air movement. Uncertainties in those heat stress risk projections are discussed and an overview of potential impacts is provided that need further research in the future. Using the database of the OptiBarn project and contemporary literature, impacts on milk yield and subsequent farm income and ammonia and methane emissions, as well as respiration and activity of cows (to evaluate the impact on animal welfare and health), are deduced. Potential mid-term and short-term adaptation strategies are outlined.
The analysis was based on data collected within several measurement campaigns in three barns conducted during the OptiBarn project. Statistical models were developed to relate the outdoor weather conditions to the indoor microclimate. The latter was related to the stress perceived by the cows using two empirical models. An ensemble of simulations from different regional climate models (RCMs) was considered to evaluate the future heat stress risk. Anticipated impacts and adaptation options were further discussed taking into account data on the animals' physiological state and behavior collected on different farms in the OptiBarn project and in contemporary literature.
2.1 On-farm measurements
Our analysis was conducted based on data from three locations in Europe: two barns in Germany and one barn in Spain. The meteorological indoor data sets covered air temperature, relative humidity and air velocity collected between summer 2015 and summer 2017.
2.1.1 Reference barn Dummerstorf – central European maritime region
The naturally ventilated dairy building is located in northeast Germany close to the Baltic Sea (Gut Dummerstorf GmbH in Mecklenburg-Western Pomerania, 42 m above sea level; see Hempel et al., 2018). It is approx. 96 m long and 34 m wide. The roof height varies from approx. 4 to 10.5 m. The internal room volume is approximately 25 000 m3, and the barn was designed for 364 dairy cows (i.e., approx. 70 m3 per animal). The barn has an open ridge slot, partly closed gable walls and long open sidewalls protected by nets and adjustable curtains (see Fig. 1). It represents a typical building design for moderate climate used, for example, in northern Germany, the Netherlands or northern USA (Mendes et al., 2015; Wang et al., 2016; Hempel et al., 2016b; Kafle et al., 2018).
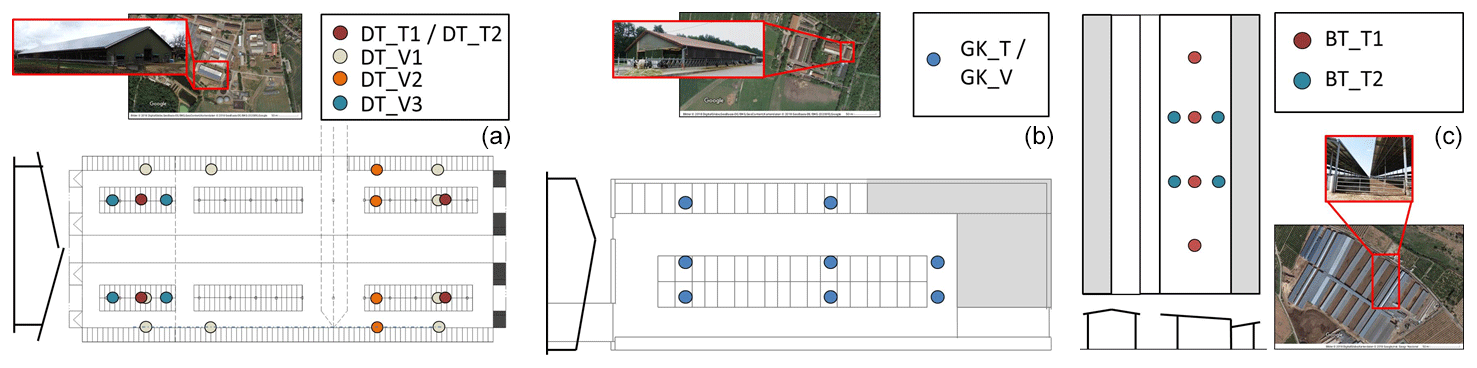
Figure 1Outer view of the reference barn (source: ATB), aerial photo of the associated farm (source: Google Maps, © 2018 DigitalGlobe; panels a and b: GeoBasis-DE/BKG, GeoContent, Kartendaten, © 2018 GeoBasis-DE/BKG (© 2009), © Google; panel c: Kartendaten © 2018 Google, Inst. Geogr. Nacional) and distribution of the sensor positions during different measurement campaigns for the three reference barns in Dummerstorf (a), Groß Kreutz (b) and Bétera (c). In addition, the roof shapes are sketched. Details on the measurement campaigns can be found in Table. 1 (cf. IDs).
Table 1Overview of on-farm measurement campaigns. Measurements were conducted approximately 3 m above the floor of the barns. The horizontal distribution of measurement points is sketched in Fig. 1 (cf. IDs). Device specifications: Comark Diligence EV N2003 sensors (Comark Limited, Hertfordshire, UK) logged temperature and relative humidity every 10 min (instantaneous value for the second). EasyLog USB 2+ sensors (Lascar Electronics Inc., USA) logged temperature and relative humidity every 5 min (instantaneous value, shortest logging rate 10 s). Three-axis ultrasonic anemometers of the Wind Master type (Gill Instruments Limited, Hampshire, UK) logged air velocity every second. Begin and end of the measurement periods are provided in the format dd-mm-yyyy.
Temperature, relative humidity and air velocity were logged at various positions inside the barn at approximately 3 m height during measurement campaigns from summer 2015 until summer 2017 (see Table 1 and Fig. 1).
2.1.2 Reference barn Groß Kreutz – central European continental region
This naturally ventilated dairy building is located in eastern Germany (Teaching and Research Institute for Animal Breeding and Animal Husbandry, Groß Kreutz, Brandenburg, 32 m above sea level; see Hempel et al., 2018). It is approx. 39 m long and 18 m wide. The height of the roof varies from approx. 3.5 to 6 m. The internal room volume is approximately 4500 m3, designed for 50 dairy cows (i.e., ca. 90 m3 per animal). The barn has a closed roof and partly closed gable walls (see Fig. 1). One long sidewall is open up to about 1.5 m height, and the opposite side is open up to the roof.
Temperature, relative humidity and air velocity were logged continuously at eight positions inside the barn at approximately 3 m height from summer 2015 until summer 2017 (see Table 1 and Fig. 1). In addition, at three of the sensor positions in the center of the barn, temperature and relative humidity were measured at four other heights between approximately 4 and 6 m.
2.1.3 Reference barn Bétera - western Mediterranean region
The commercial naturally ventilated building is located in eastern Spain (More Holstein S. L., Bétera, Valencia, 125 m above sea level). It is approx. 137 m long and 18 m wide with open walls (fences) and a broad roof opening (see Fig. 1). The roof height varies from approx. 4.5 to 6 m. The internal room volume is approximately 12700 m3, designed for 192 dairy cows (i.e., approx. 66 m3 per animal).
Temperature and relative humidity were logged at various positions inside the barn at approximately 3 m height during two measurement campaigns in summer 2016 and 2017 (see Table 1 and Fig. 1).
2.2 Outdoor climate data
Our outdoor climate data consist of station observations from local weather services. We employed the observation network of the Deutscher Wetterdienst (DWD) for both reference barns in Germany. The observations for Spain were taken from the National Climatic Data Center (NCDC) archive of the National Oceanic and Atmospheric Administration (NOAA). In detail, observations for Valencia were based on METeorological Aerodrome Reports (METARs) of Valencia Airport.

For each barn we selected one meteorological station based on two constraints: (1) the station had to be close to the respective barn to assure that the station weather observations are representative for the weather near the barn and (2) the station should cover at least the same period as the indoor measurements to permit a reasonable indoor model calibration. Table 2 summarizes the stations chosen for each reference barn and their respective focus regions.
All stations reported data with a temporal resolution of at least 1 h. Where necessary, the unprocessed observations were aggregated to hourly values. Missing measurements were filled using a hot deck imputation method (Ford, 1983) based on temporal analogs. If no analog existed and the gap was smaller than 5 h, a linear interpolation between measurement dates was used. The hot deck imputation method comprised all meteorological stations within a 150 km radius around the station under consideration.
Table 3Modeling matrix of driving global models – rows – and the respective regional models – columns – used in this study. The numbers indicate the respective RCP scenarios covered by each GCM–RCM combination.

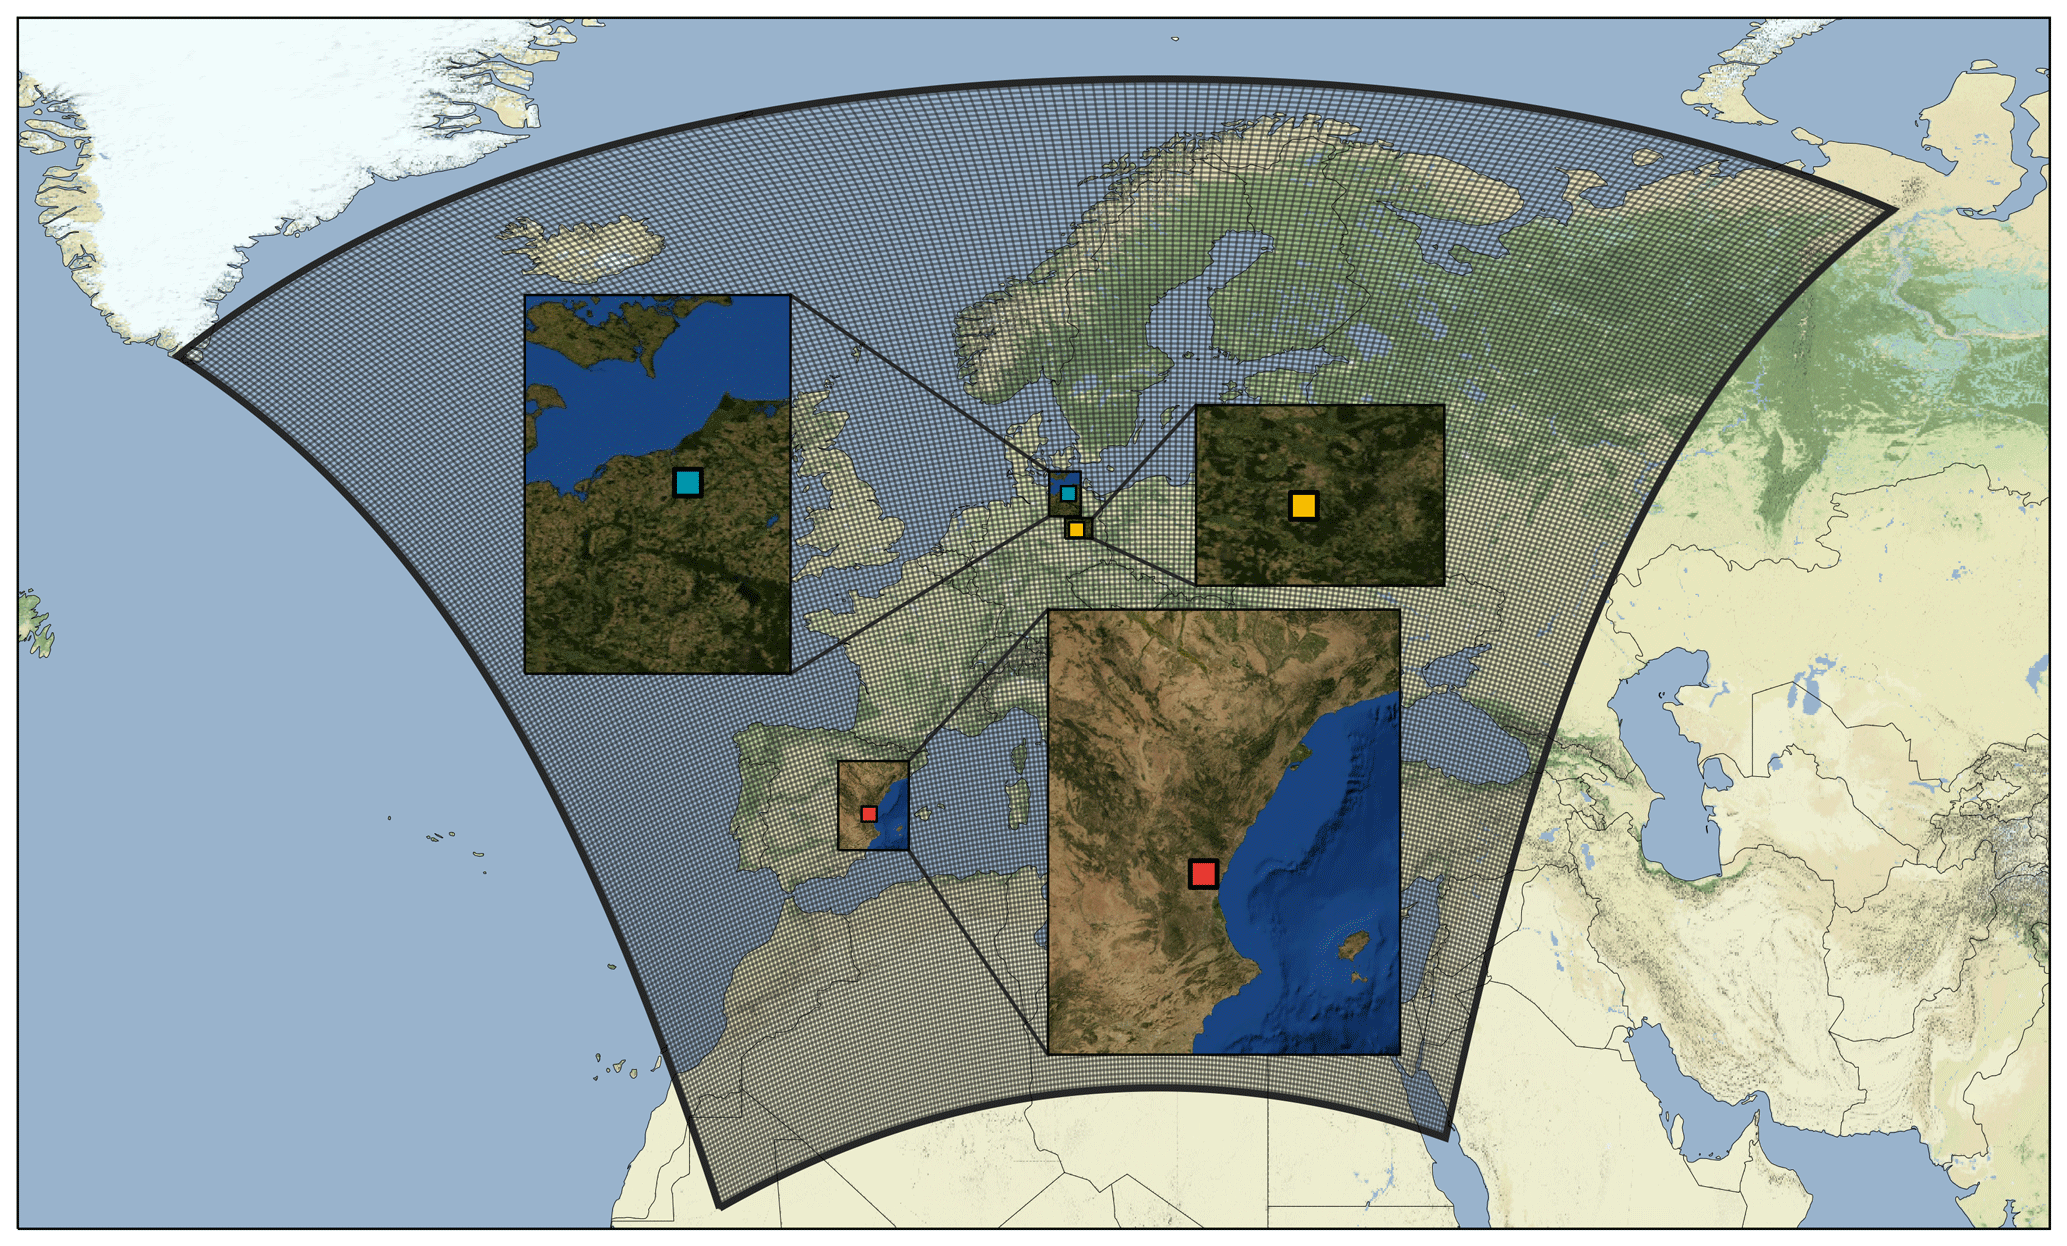
Figure 2Map of the focus regions considered in our analysis. The surrounding lattice represents the RCM simulation domain (CORDEX-EUR11). The colored boxes mark the positions of the selected meteorological stations of each focus region. The map was created based on material from http://maps.stamen.com (last access: 4 March 2019; for the background) and https://map1c.vis.earthdata.nasa.gov/wmts-geo/wmts.cgi (last access: 4 March 2019; BlueMarble_ShadedRelief_Bathymetry for the zoomed regions).
To assess the impact of the anticipated climate change we used an ensemble of regional model projections. Table 3 summarizes the regional and driving global models used in our analysis. The simulations were partially conducted within the ReKliEs-De (http://reklies.hlnug.de, last access: 11 April 2019) project and conform to the CORDEX-EUR11 specifications defined in the framework of the Coordinated Regional Downscaling Experiment (CORDEX, http://cordex.org, last access: 11 April 2019; Giorgi and Gutowski, 2015). Figure 2 presents the full simulation domain defined within this framework together with our three focus regions containing the reference barns. The simulations were available on a daily timescale with a horizontal resolution of 0.11∘ (approx. 12.5 km). They covered the period from 1970 to 2098. For each focus region we averaged the time series of the nine grid boxes surrounding the meteorological station (see Fig. 2). The RCMs were driven by eight different global climate models (GCMs) in total taking into account three different greenhouse gas concentration scenarios for the period 2006 to 2100, i.e., representative concentration pathways (RCPs) as defined in the IPCC's Fifth Assessment Report (AR5) (Pachauri et al., 2014). Here, we considered anticipated radiative forcings of 2.6 W m−2 (RCP 2.6), 4.5 W m−2 (RCP 4.5) and 8.5 W m−2 (RCP 8.5) in 2100. For the years 1970 to 2005 the RCMs used the observed greenhouse gas concentrations as boundary condition.
Before applying the simulations to our indoor climate model we adjusted the biases. For temperature and relative humidity we used the ISIMIP-FastTrack bias adjustment method using the station observations as reference (Hempel et al., 2013). The two horizontal wind components were adjusted together using a two-dimensional adjustment approach of Cannon (2018). Furthermore, we interpolated the daily values to hourly time steps using a regularized multivariate linear regression model. Each 24 h of a day was mapped from daily values separately, i.e., our temporal downscaling does not account for inter-day dependencies.
2.3 Statistical indoor climate model
To analyze the impact of the anticipated climate change on animal welfare and linked economic and environmental factors, we need to determine the microclimate inside the barn from the outdoor weather conditions. Therefore we used a purely data-driven statistical approach, as it permits a fast yet powerful simulation of the indoor microclimate conditions using the available observations. Depending on the statistical approach, it implicitly implements the complex relationships between outdoor and indoor conditions depending on the building design, materials, orientation and outdoor environment. Compared to dynamical approaches, it allows also an easy and automatized calibration for various climate conditions and barn layouts using individual configurations of observations (Gebremedhin and Wu, 2005; Wu et al., 2012; Fiedler et al., 2014).
We derived our statistical indoor climate model using outdoor weather conditions as predictors to estimate the microclimate inside each barn. We focused our modeling on those variables that have the most significant impact on animal climate stress, namely temperature, relative humidity and wind (Mader et al., 2006) inside the barn. Solar radiation was neglected for our model as we assumed sufficient roof insulation and only minor radiation entries via the openings. In order to reduce the degree of complexity, the indoor model uses only hourly and spatially averaged values of the whole barn (see discussion of uncertainty in calibration data in Sect. 3.3.4).
As our reference barns were naturally ventilated, the outdoor weather conditions significantly influence the indoor conditions. However, the relationship is complex and based on nonlinear physical processes. To simulate this relationship we tested several different statistical machine learning approaches. Due to the unique outdoor conditions in each region and the specific layout and building materials for each barn, we trained a separate model for each barn. We tested the artificial neural network (ANN) approach, linear regression models with and without regularization, random forest regression, and support vector regression models, all with different hyperparameter settings. The models were trained to predict at any hour the temperature, relative humidity and the two horizontal wind components inside the barn (predictands) based on outdoor temperature, relative humidity, zonal and meridional wind, sea level pressure, and global radiation (predictors). For the Mediterranean region the model was set up with temperature and relative humidity as predictors and predictands only, due to the reduced observation data set for outdoor (Valencia) and indoor (Bétera) measurements. Each hour of the indoor predictands was modeled separately. Hence our model did not account for a memory effect of the indoor variables directly. However, indirectly we considered a memory effect and lagged responses by using the values of the outdoor predictors 2 h before and 2 h after the predicted time step. Overall our feature space consists of 30 dimensions (6 predictors times 5 h) for Dummerstorf and Groß Kreutz and 10 dimensions (2 predictors times 5 h) for Bétera.
Table 4Best performing ANN configurations after a grid search hyperparameter optimization. We optimized the ANN for each reference barn separately. The layout configurations refer to the number of nodes in each hidden layer. The predictor and predictand abbreviations are defined by T – temperature, RH – relative humidity, W – zonal and meridional wind, P – sea level pressure, and R – global radiation.
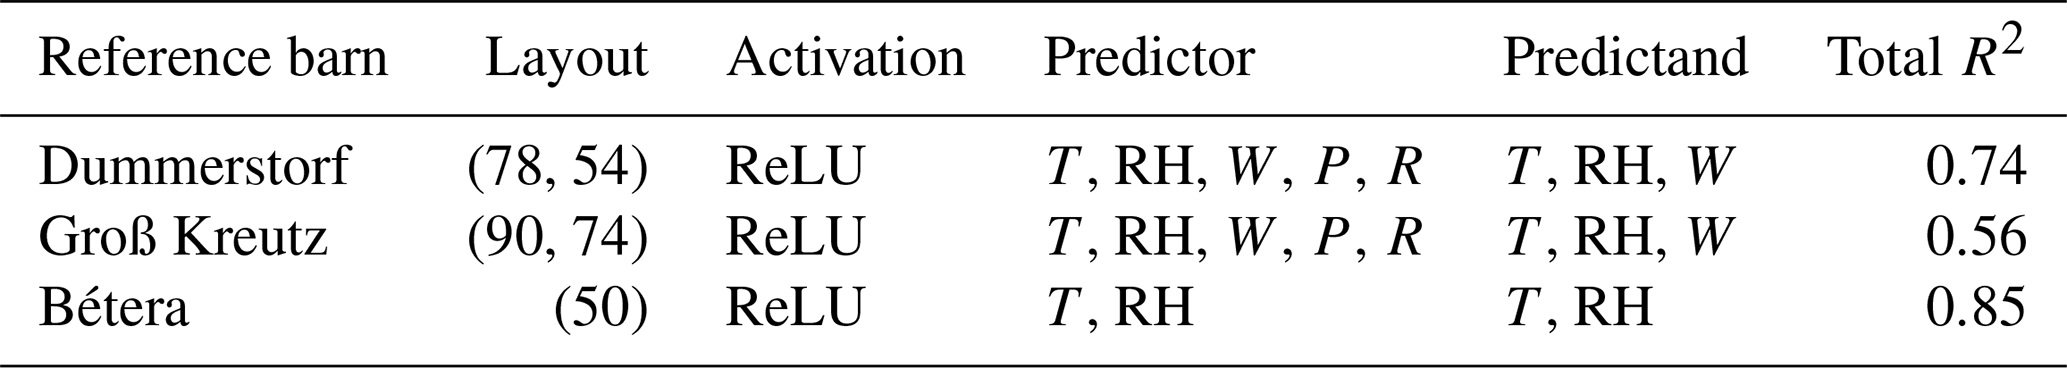
According to our analysis, the model type with the best performance was the ANN (Gurney, 1997; Heaton, 2015). To limit the complexity of the ANN we choose a simple dense network design. We tested different hyperparameter configurations of the ANN using up to three hidden layers with varying numbers of nodes in each layer and different activation functions. To train our ANN we used backpropagation (Werbos, 1974) with a mean squared error loss function. We prevented the network from overfitting by using a dropout regularization (Srivastava et al., 2014) and 8-fold cross validation. Table 4 summarizes the best performing ANN configuration for each reference barn along with the respective cross validation R2 as performance score. For all reference barns we found a rectified linear unit (ReLU) activation function in each node as the optimal choice. The output layer uses a linear activation function as it maps to the real valued predictands. The final network layout for Dummerstorf and Groß Kreutz is more complex compared to Bétera due to the lower number of predictors and predictands for the latter barn. The different predictands are also reflected in lower R2 scores for the German barns with 0.74 and 0.56 for Dummerstorf and Groß Kreutz, respectively, compared to 0.85 for Bétera. The low performance of the wind components inside the barn resulted in the lower total R2 score.
2.4 Statistical evaluation
As shown in Table 3, our RCM ensemble was imbalanced towards the CLM-CCLM4-8-17, GERICS-REMO2015 and SMHI-RCA4 regional models, with six, five and five driving GCMs, respectively. This is compared to only two driving models for both KNMI-RACMO22E and DMI-HIRHAM5 and one for MPI-CSC-REMO2009. This imbalance would propagate into our uncertainty estimation if we naively assume that each simulation, i.e., each GCM–RCM combination, is equally weighted in the ensemble. However, our assumption is that each single RCM should be equally weighted. We think of the different GCM simulations driving the same RCM as an additional artificial variability in that RCM. Hence we consider three different sources of uncertainty in our statistical evaluation of the full model ensemble:
-
Temporal uncertainty is estimated from the year-to-year variability of the time series of each single simulation.
-
GCM uncertainty is estimated from different GCMs driving the same RCM.
-
RCM uncertainty is estimated from the different RCM simulations.
All these sources are coupled and the underlying probability distribution is not necessarily Gaussian. To avoid the usage of a complex statistical model we adopted a simple bootstrap method for the statistical evaluation of the full ensemble (Efron, 1979; Efron and Tibshirani, 1986).
We draw 10 000 random samples of the GCM–RCM matrix keeping the same structure (i.e., the same number of total RCMs, the same number of GCMs per RCM). This is done in three steps. In the first step we draw six RCMs out of the six available. In the second step we draw randomly from the available GCMs of the respective RCM. Here we draw the same number of times as GCMs are available for that RCM (five for SMHI-RCA4, two for KNMI-RACMO22E, two for DMI-HIRHAM5, six for CLM-CCLM4-8-17, five for GERICS-REMO20015 and one for MPI-CSC-REMO2009). In the last step we draw randomly from the available reference years (30 out of 1971–2000) for each RCM–GCM combination. This way we end up with a bootstrap sample with the same structure and magnitude as the original modeling matrix. For each sample we calculate first the time average. Then we average over all GCM simulations of one RCM. We end up with six averaged RCMs for each sample. This way we can estimate the spread of the ensemble considering three uncertainty sources and their propagation.
2.5 Empirical heat stress models
Heat stress conditions for dairy cattle are expected to occur much more frequently in our focus regions than cold stress conditions. Hence, we focused our assessment on heat stress. To quantify the effect of the indoor microclimate on the animal perceived stress we considered two different heat stress indices. These empirical models link air temperature with additional state variables of the indoor air in order to evaluate the anticipated individual comfort or discomfort under hot environmental conditions (e.g., hot and humid air appears particularly warm). The two selected indices differ according to the number of state variables considered. Heat stress was evaluated in term of thresholds (see Table 5).
Table 5Categories of heat stress levels used for our assessment. For temperature humidity index (THI) we used the thresholds defined by Collier based on milk-yield losses (Collier et al., 2012). For equivalent temperature index for cattle (ETIC) we used the thresholds defined by Wang based on a linear regression between THI and ETIC without wind (v=0 m s−1) and solar radiation (i.e., Q=0 W m−2) (Wang et al., 2018a).
First, we considered the temperature humidity index (THI; see Eq. 1) originally published in this form by the United States National Weather Service (NRC, 1971). Since the early 1990s the index was frequently used to evaluate heat stress in cattle using the following definition:
with air temperature (T, ∘C) and relative humidity (RH, %). The THI incorporates dry bulb temperature and relative humidity, but it does not take into account wind speed or solar radiation (Dikmen and Hansen, 2009; Lees et al., 2018; Wang et al., 2018b).
Second, we considered the equivalent temperature index for cattle (ETIC; see Eq. 2), which was developed within the OptiBarn project (Wang et al., 2018b). We used the following ETIC definition:
with air temperature T (∘C), relative humidity RH (%), air velocity v (m s−1) and solar radiation Q (W m−2).
For the evaluation of the heat stress risk, we defined the number of heat stress events (HSEs) as the number of hours of at least moderate heat stress, i.e., with indoor THI ≥72 and correspondingly ETIC ≥20 (see Table 5). In addition, we considered the duration of heat stress events (HSED) as the length of periods of consecutive hours of at least moderate heat stress. In the analysis of the heat stress risk we considered changes compared to a reference period of 1971–2000.
2.6 Impact assessment
Heat stress is known to affect farm economics (e.g., milk yield and quality) and the environment (emissions) as well as animal physiology and behavior, resulting in impacts on animal welfare and health. We used physiological and behavioral data collected in the OptiBarn project as well as contemporary literature for the impact assessment.
Since the underlying assumptions and compiled data in the quantification of the heat stress impacts introduce considerable additional uncertainty, we will only concentrate on the magnitude of impacts. We focused our assessment on the RCP 8.5 scenario to estimate impacts under the strongest anticipated climate change. Furthermore, we neglected the range of uncertainty in the model projections and potential adaptation measures (related, for example, to housing, feeding or breeding). Moreover, the physiological adaptation (due to a general temperature increase and prolonged heat load duration) and the effect of heat load aggregation over the day, i.e., the number of heat stress hours where the THI was above the onset of mild heat stress (THI ≥68; see Table 5), were not taken into consideration (St-Pierre et al., 2003). The daily maximum THI was not explicitly considered and the further aggravation of impacts for THI >72 was neglected.
For the estimation of impacts, where the increase or decline rates were given per THI unit in literature, we used a factor of 4 to scale the rates as in our results we considered the increase in at least moderate heat stress events (i.e., THI ≥72 relative to a heat stress threshold of 68, namely at least 4 THI units).
As many impacts were related to daily THI values in literature, we need to estimate the number of heat stress days (HSD) based on the hourly THI values. This, however, requires the introduction of additional constrains (e.g., what is the minimal number of heat stress hours to make a heat stress day). To simplify the accumulation of hourly heat stress events to daily mean heat stress we assume that only one period of consecutive heat stress hours occurs per day. As a consequence, we approximate the number of heat stress days by dividing the average projected number of heat stress events by its duration (i.e., HSE/HSED).
Note that regional differences in the impacts might be underrepresented in the overall estimation as there were only data for three barns available.
For the sake of simplicity, projections of the indoor climate and the estimated heat stress risk for the housed dairy cattle are shown for individual barns. Seasonal characteristics as well as differences between the three RCP scenarios and the two stress indices emerge.
3.1 Indoor climate changes
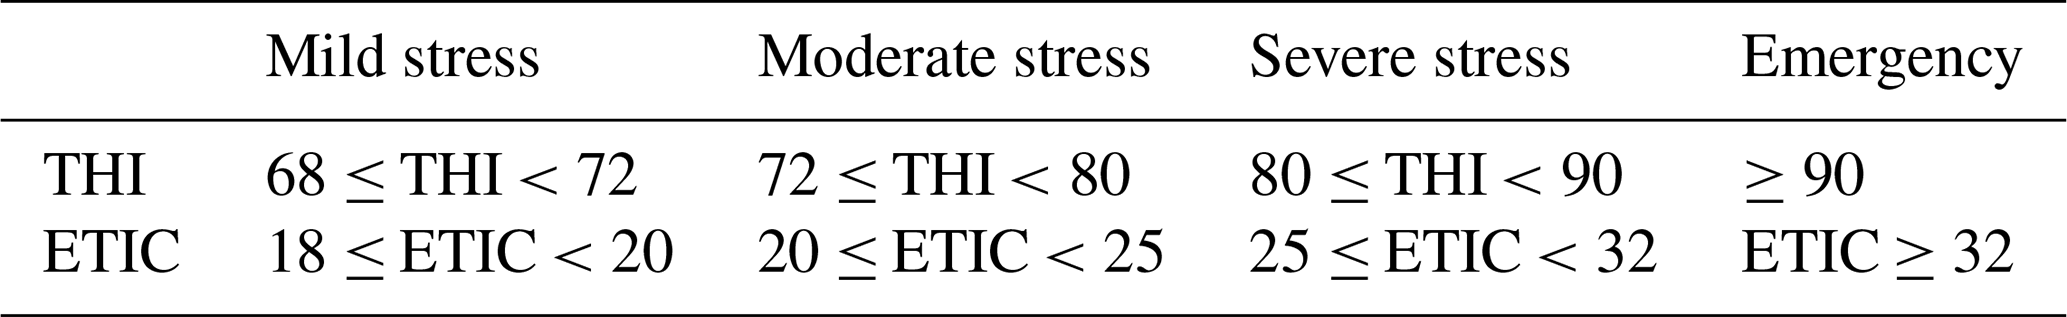
The projected climate change and thus the anticipated indoor climate differed depending on the greenhouse gas concentration scenario and the region under consideration. Overall the temperature is expected to increase in all three focus regions until the end of the century between 1 and 5 ∘C. The statistical model simulations showed a slightly higher increase in indoor temperatures for the barn in the western Mediterranean compared to those in the central European focus regions (see Fig. 3).
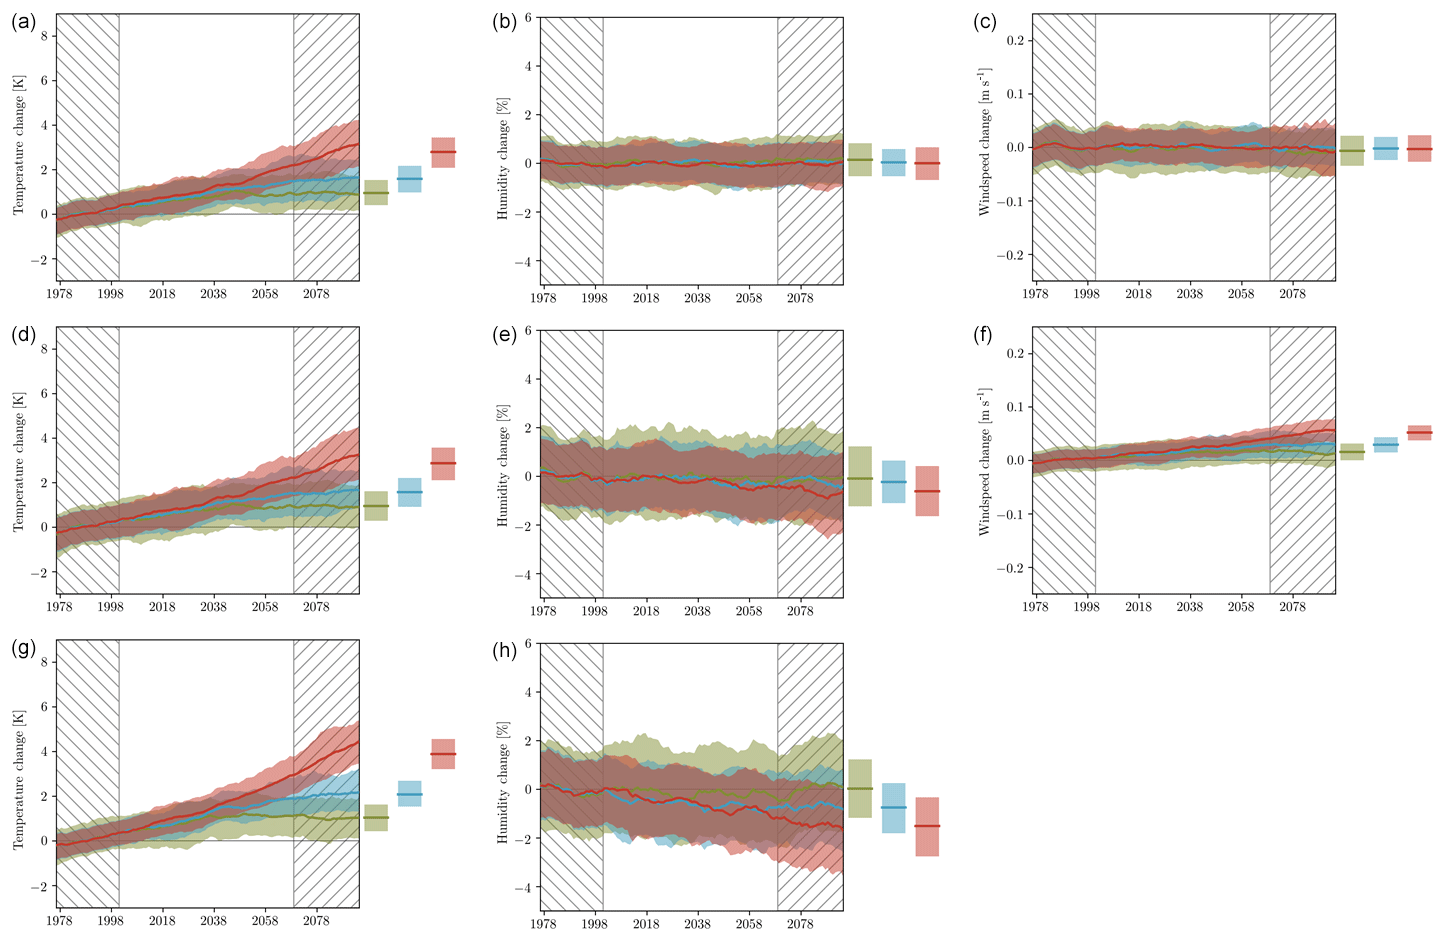
Figure 3Projected change in indoor temperature, humidity and wind in the three focus regions of this study under RCP 2.6 (green), RCP 4.5 (blue) and RCP 8.5 (red). Regions: central European maritime region with reference weather station Rostock-Warnemünde (a–c), central European continental region with reference weather station Potsdam (d–f) and western Mediterranean region with reference weather station Valencia (g, h).
The anticipated relative humidity remained approximately constant in the barn in the central European maritime region and decreased towards the south (with a stronger decrease for the barn in the Mediterranean region than for the barn in the central European continental region). All changes were well below 5 % and in most cases not statistically significant. However, the decrease in the Mediterranean region is in line with the anticipated temperature increase and precipitation decrease.
For the reference barn Groß Kreutz (central European continental region) the climate model ensemble projected a slight increase in the near-surface wind under all three RCP scenarios. The RCP 8.5 showed the largest increase in the average indoor wind speed with a value of up to 0.05 m s−1 over the century (see Fig. 3). This means a decrease by more than 10 % taking into account that the typical average wind speed in the barn today is around 0.4 m s−1. The change was particularly pronounced in the summer months with up to approximately 0.15 m s−1 during June, July and August compared to almost 0 m s−1 in December, January, February (results not shown).
In contrast, in the reference barn Dummerstorf (central European maritime region) no significant annual trend in the average wind speed was found (see Fig. 3). Largest changes were projected in autumn (up to −0.1 m s−1) and winter (up to 0.15 m s−1) under RCP 8.5, but model simulations were discordant in regard to the trends (results not shown).
Wind projections for the reference barn Bétera (Mediterranean region) were not available due to a lack of sufficiently long wind measurements in the barn.
3.2 Heat stress risk
The number and duration of heat stress events were derived from the indoor climate projections. The risk of moderate heat stress showed an overall increasing trend.
3.2.1 Risk under different RCPs
In order to assess the effect of different atmospheric greenhouse gas concentrations on the heat stress risk, we considered the example of the reference barn Groß Kreutz (Germany, central European continental region), as for this location we could make use of the most comprehensive and homogeneous data set. The heat stress risks under RCP 2.6, RCP 4.5 and RCP 8.5 were evaluated using the number and duration of anticipated heat stress events based on the projected indoor THI as described in Sect. 2.5 (see Fig. 4).
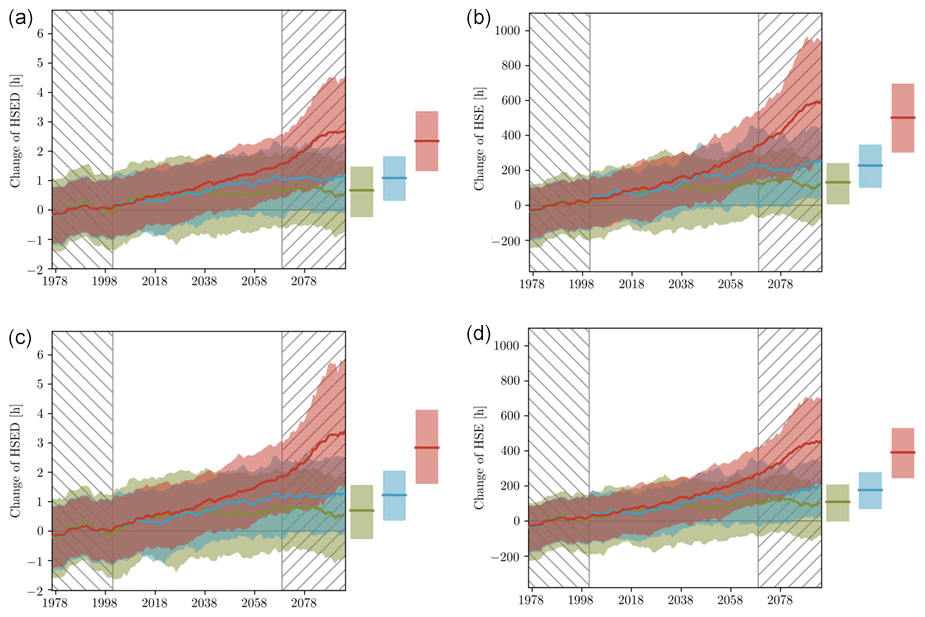
Figure 4Projected change in heat stress events in the reference barn in central Europe (annual changes in panels a and b and summer changes in panels c and d). Modifications in average duration (average consecutive hours) and number (number of consecutive hours) of moderate stress events under RCP 2.6 (green), RCP 4.5 (blue) and RCP 8.5 (red) are plotted based on the evolution of the temperature humidity index (THI) with a threshold of 72.
Until the mid-21st century (≈2040) there is no significant difference between the projections under different RCP scenarios. The average duration of the stress events is expected to increase up to approximately 1 h in all scenarios, while the number of events is expected to increase by up to approximately 150 (i.e., up to approximately 2 % of all hours of a year, corresponding to 6 % of all hours of a summer, will be classified as at least moderate stress events in addition to the current situation).
For the second half of the 21st century, the average duration of heat stress events is expected to stay at the mid-century level under RCP 2.6 and RCP 4.5. For the extreme scenario RCP 8.5, the increase continues up to approximately 3 h. The number of heat stress events is projected to stay approximately at the mid-century level under RCP 2.6 and increases only slightly during the second half of the century under RCP 4.5 (approximately 150 additional heat stress events for RCP 2.6 and 200 for RCP 4.5). Under RCP 8.5, however, the number of additional heat stress events increases up to approximately 600, i.e., nearly 7 % of all hours of a year will be additionally classified as heat stress events, most pronounced in the summer season. Hence, approximately 27 % of all summer hours, i.e., more than every fourth hour, will be characterized by at least moderate heat stress conditions in addition by the end of the century.
Despite the described relations between the ensemble averages for each RCP scenario, there was a range of uncertainty of approximately ±1 h regarding the duration and ±200 regarding the number.
3.2.2 Regional differences
In order to evaluate the regional differences in climate change impacts on dairy farming, we considered the example of two reference barns in maritime regions, one in central Europe and one in the Mediterranean region (see Fig. 5). As in Sect. 3.2.1 the heat stress risks under RCP 2.6, RCP 4.5 and RCP 8.5 were evaluated in terms of number and duration of heat stress events as described in Sect. 2.5.

Figure 5Projected change in heat stress events in the reference barns in maritime regions in central Europe (top two rows) versus Mediterranean region (bottom two rows). Modifications in annual (first row) and summer (second row) average of duration (average consecutive hours) and number (number of consecutive hours) of moderate stress events under RCP 2.6 (green), RCP 4.5 (blue) and RCP 8.5 (red) are plotted based on the temperature humidity index (THI) with a threshold of 72.
Although the annual temperature increase does not differ a lot among the regions (Fig. 3), the implications in terms of critical THI values were rather different for the two regions. By the mid-21st century we found an increase in the duration of heat stress events of approximately 1.5 h for central Europe and 2.5 h for the Mediterranean region under all RCPs. For RCP 2.6 this is also true until the end of the century. Under RCP 4.5 in the second half of the century an increase of 2 h for central Europe versus 5 h for the Mediterranean region was projected. For RCP 8.5 the deviation between the regions is even larger with an increase of 4 h in central Europe versus 17 h in the Mediterranean region. The latter implies that there will be barely any recovery phases for the cows in the reference barn in the Mediterranean region.
The change in the number of heat stress events was even more diverse among the regions and RCPs. While for the barn in central Europe up to approximately 200 additional hours of heat stress are expected (i.e., even less than for the barn in the central European continental region described in the previous subsection), for the Mediterranean region the increase was much stronger: under RCP 2.6 approximately 300 additional heat stress events (i.e., 4 % of all hours of a year), under RCP 4.5 approximately 800 additional heat stress events (i.e., nearly 9 % of all hours of a year) and under RCP 8.5 approximately 1800 additional heat stress events (i.e., nearly 21 % of all hours of a year) were projected. In addition, in central Europe most of the additional heat stress events occurred in the summer season. In the Mediterranean region, only approximately half of the increase was anticipated for summer, while there was a significant increase in the number of heat stress events projected for spring and autumn.
Again, we focused the comparison on the ensemble averages, and there was a range of uncertainty of ±200 regarding the number and approximately ±2 h (central Europe) and ±5 h (Mediterranean) regarding the duration. Towards the end of the century, the ranges tend to further increase, particularly for the RCP 8.5 scenario.
3.2.3 The effect of air movement
We investigated the impact of wind as additional environmental parameter to evaluate the heat stress risk using the example of the reference barn Groß Kreutz (Germany, central European continental region) and the heat stress index ETIC.
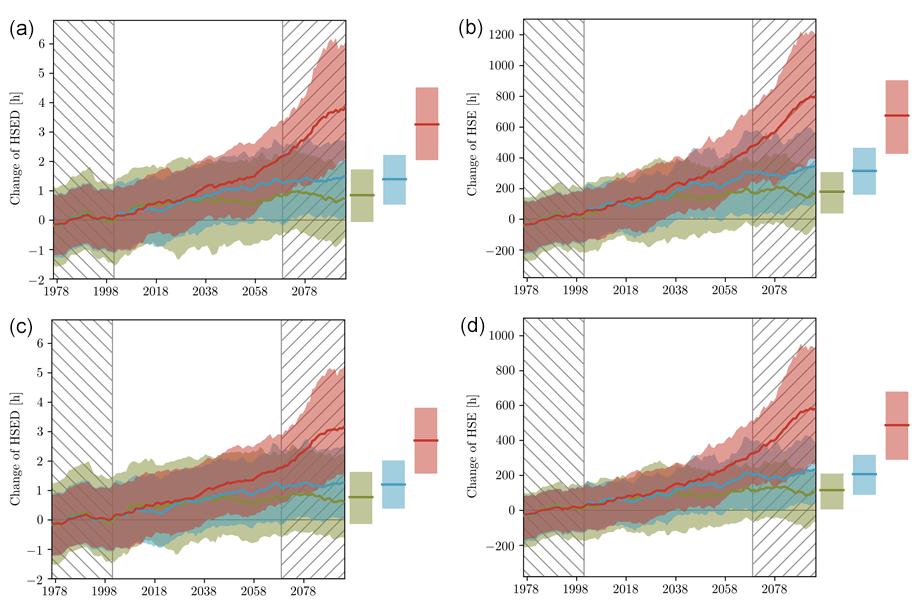
Figure 6Projected change in heat stress events in the reference barn in central Europe without (a, b) and with (c, d) consideration of near-surface wind. Modifications in annual average of duration (average consecutive hours) and number (number of consecutive hours) of at least moderate stress events under RCP 2.6 (green), RCP 4.5 (blue) and RCP 8.5 (red) are plotted based on the equivalent temperature index for cattle (ETIC) with a threshold of 20.
The change in duration and number of heat stress events was investigated using ETIC with and without wind, neglecting radiation effects in both cases (see Fig. 6). We found a general tendency towards an increase in the duration and number of heat stress events by the end of the century, which was on the same order of magnitude as predicted using the THI (see Fig. 6 compared to Fig. 4).
Without the wind effect (i.e., ETIC with v=0 m s−1 at all time points; see Fig. 6a, b) the projected increase in the duration of heat stress was under RCP 8.5 on average 4 h (ETIC) compared to 3 h (THI). Taking the range of the model ensemble into consideration, it was even 6 h (ETIC) versus 4.5 h (THI). Similar deviations were observed for the estimated increase in the number of heat stress events. Here, ETIC under RCP 8.5 resulted in on average 800 more heat stress events (up to 1200 considering the uncertainty of the model ensemble), while THI resulted in on average 600 more heat stress events (up to 900 considering the uncertainty in the model ensemble).
Taking into account the wind in the ETIC calculation (see Fig. 6c, d), the heat stress risk decreased as the wind increased (particularly in summer), which had a cooling effect. While ETIC under RCP 8.5 projected on average approximately 800 additional heat stress events without wind effect, on average approximately 600 additional heat stress events were projected with wind effect. This is a relative reduction in the number of heat stress events of approximately 25 % due to changes in the wind regime. However, the projected heat stress risk considering ETIC with the wind effect was almost the same as that projected with the THI which does not include the wind effect at all.
3.3 Model uncertainty
While our results showed a general tendency of increasing heat stress risk, there was a large uncertainty in the magnitude of the anticipated increase. The overall model uncertainty involves (1) the climate models used to drive the indoor climate model, (2) the considered greenhouse gas concentration scenarios, (3) the selected index and threshold that was used to define heat stress events, and (4) the accuracy of measurements used to calibrate the indoor climate model.
3.3.1 Climate model ensembles
The span of anticipated climate signals was well represented in our ensemble with GCMs projecting strong and weak changes in the global mean temperature and precipitation, respectively (Warszawski et al., 2014). The RCM–GCM combinations capture the edges of the intermodel variability in the CORDEX-EUR ensemble in terms of biases in temperature and precipitation (see Dosio, 2016).
However, only a limited number of runs per RCP was available for our study, namely 11 for RCP 2.6, 12 for RCP 4.5 and 21 for RCP 8.5. Increasing the number of simulations might increase our estimated uncertainty ranges. In order to account for the imbalanced sampling among the possible climate signals (see sparse modeling matrix in Table 3), we used a bootstrapping algorithm for the statistical analysis to evaluate the heat stress risk. Our analysis shows a similar range of the anticipated changes in the number of heat stress events for all three barns as well as all RCPs and time slices. The uncertainty in the anticipated duration of heat stress events was also similar among the RCPs and time slices.
The uncertainty in the duration, however, varied regionally. In the Mediterranean region, where the largest impacts are expected, it was particularly high, yielding additional challenges for adaption. These regional differences in the uncertainty might be, however, to some degree also caused by the fact that the calibration data sets for the indoor-THI model differed in regard to comprehensiveness and homogeneity.
3.3.2 RCP scenarios
Earlier other authors used one climate model, one emission scenario and the outdoor THI to perform a similar study for Spain (Segnalini et al., 2013). Our study, on the other hand, was based on a model ensemble and used an indoor THI together with multiple recent emission scenarios to cover the full range of future socioeconomic pathways.
Segnalini et al. (2013) derived a slight increase in the heat stress risk mainly in summer. Our results based on the indoor THI under RCP 2.6 were well in line with this former study. However, based on the more recent climate projections, a larger ensemble of climate models and incorporating the effect of housing on the THI, our results also indicated that the former projections can be understood as some kind of best case scenario. The projected indoor temperature change by the end of the 21st century deviated in our study among the RCPs by approximately 2 ∘C in the barns in central Europe and 4 ∘C in the barn in the Mediterranean region (see Fig. 3). At the same time, the projected change of annual relative humidity deviated by less then 3 %. Thus, the THI increase is likely to be higher than previously assumed.
Moreover, the projected change in temperature, humidity and wind resulted in an increase in the duration of heat stress events, which was approximately 3 h (central European regions) and 17 h (Mediterranean region) less under RCP 2.6 than under RCP 8.5, respectively. In addition, approximately 5 % heat stress hours less per year (relative to the total number of hours in a year) were projected under RCP 2.6 compared to RCP 8.5 for the central European regions by the end of the century. In the Mediterranean region the deviation between RCP 2.6 and RCP 8.5 was approximately 17 %. This implies that with the continuation of global warming the regional differences will be amplified with higher greenhouse gas concentrations.
The RCP scenarios considered in our study were associated with different socioeconomic, technological and political developments that yield different atmospheric greenhouse gas concentrations. Feedback loops induced by changing duration and number of heat stress events were not included. However, it is known that the net emissions from cattle husbandry (dependent on the storage, treatment and application of manure and slurry as well as on the production level and feed of the ruminants) are influenced by environmental parameters such as temperature and humidity (Monteny et al., 2001). Increased heat stress may yield higher ammonia and methane emissions affecting aerosol formation and amplifying the increase in greenhouse gas concentration as discussed in Sect. 3.4.2.
Such effects are, however, underexplored so far and should be addressed in future studies to further develop representative greenhouse gas and ammonia concentration scenarios for climate impact assessments.
3.3.3 Stress index
A lot of cattle-related thermal indices have been proposed in literature, two of which we considered in our study (Bianca, 1962; Mader et al., 2006; Gaughan et al., 2008; Mader et al., 2010; Da Silva et al., 2015; Lees et al., 2018; Wang et al., 2018b). The genetic basis used to derive the indices relative to the dominating genotypic conditions in our study (including resilience types and future adaptation) represents additional incalculable factors. Our results (see Sect. 3.2.3) indicated that the uncertainty that was introduced by choosing one of the stress indices (THI or ETIC with or without wind) together with a particular threshold was on the same order of magnitude as the wind effect. This leads to the assumption that the effect of wind speed could be neglected in heat stress risk projections using the common indices.
It has, however, to be noted that these results referred only to an averaged wind speed in the barn under consideration, while the distribution of the air flow inside the building is very sensitive to changes in the inflow conditions (e.g., surrounding building or planting) as well as the building design (see Sect. 3.3.4) (Hempel et al., 2015b; Yi et al., 2018). The impact of including or neglecting the wind may be different for other barns or even when considering heat stress levels in individual locations of the same barn.
The location of the animals inside the barn is also crucial in regards to shading as the lack of shade shifts the heat stress threshold towards lower ambient temperatures (e.g., body temperature increases earlier) (Berman, 2005; Kendall et al., 2006). This effect was neglected in our study as the cows were free to move inside the barns and could look for shade almost all the time. The roof height and insulation were considered sufficient to avoid direct radiation effects. The validity of this approximation depends on the building design. Larger radiation effects can be expected in the reference barn in Bétera (Spain, western Mediterranean region), which has a wide roof opening compared to the reference barn in Groß Kreutz (Germany, central European continental region), which has no roof opening but only roof lights.
Moreover, the projected indoor temperature, humidity and wind were not linearly translated into heat stress events, as in our study heat stress was evaluated in terms of critical thresholds. The choice of the threshold affects the risk assessment and depends on the considered indicator (e.g., milk yield, body temperature, respiration rate, rumination or lying time). The threshold we used for THI was based on milk-yield depression and related to respiration rate in literature (Bohmanova et al., 2007; Collier et al., 2012). Although based on the same indicator, the thresholds for THI and ETIC differ slightly due to the imperfect correlation and rounding when ETIC thresholds were derived from THI thresholds with a linear transfer function (Wang et al., 2018b).
In addition, the thresholds provided in literature only refer to some kind of prototypical cattle. The actual threshold is animal-specific and depends on the local environment to which the animals are adapted (Bohmanova et al., 2007). Referring to the thresholds defined by Collier (see Sect. 2.5), for example, Israeli Holstein in summer in Israel are permanently under heat stress conditions, while producing a similar amount of milk or even more than Holstein Frisian in Germany, as breed, barn design and cooling management are already adapted to the local climate conditions (Pinto et al., 2019a, c). As a consequence, due to the regional adaptation the threshold for moderate stress in our central European focus regions may relate only to mild stress in our Mediterranean focus region.
Furthermore, under heat stress conditions cows tend to adapt their body posture together with the respiration rate (Pinto et al., 2019b). As laying down decreases the body surface area of cows that is exposed to air by approximately 42 %, the effect of wind differs depending on the body posture. As a consequence, lying cows increase the respiration rate significantly more than cows in standing posture and cows with higher core body temperature tend to stand up (Allen et al., 2015; Hempel et al., 2016a). As body posture changes, depending on the barn management (e.g., feeding or milking times) and in reaction to the ambient climate conditions, may occur simultaneously, additional uncertainty in the threshold selection is introduced.
Finally, milk yield, lactation phase and age influence directly the heat stress susceptibility. Because of the metabolized energy used for milk production, high-yielding cows have significantly more heat to dissipate than low-yielding cows and thus are more susceptible to heat stress (Kadzere et al., 2002; West, 2003; Spiers et al., 2004). Cows at the beginning of lactation tend to produce more milk than cows during a late lactation period, yielding higher heat stress susceptibility. In addition, there are pieces of evidence that older (multiparous) cows are more affected by heat load than young (primiparous) ones (Bernabucci et al., 2014). As the herds in our reference barns consist of cows of different ages and lactation phases, and hence different milk yields, the projected heat stress risks will apply only for herd averages.
With the breeding towards higher milk yields of the individual cows, as observed in the past, the thresholds for heat stress can be expected to further decrease on a herd level (Carabano et al., 2016). This will amplify the projected heat stress risks. However, further quantitative studies are required to evaluate to which degree the thresholds will decrease in the future in the focus regions.
3.3.4 Calibration data
Besides systematic errors related to the measurement device accuracy and long-term stability, the spatial and temporal variability in the outdoor and indoor measurements, which were used to derive and calibrate our indoor climate model, introduces uncertainty related to the sampling procedure.
For outdoor measurements (i.e., weather observations from meteorological observation stations) this relates mainly to the question of if the weather conditions at the meteorological station are connected to those near the barn. Here the aspect of closeness is crucial, as well as topographic and orographic considerations which affect particularly the dynamics of the humidity time series (e.g., the autocorrelation function decreases faster for Rostock-Warnemünde than for Dummerstorf potentially because it is closer to the sea; Hempel et al., 2018). In order to minimize the impact of such complex effects, we applied the artificial neural network approach and considered a time lag of ±2 h (see Sect. 2.3).
For indoor measurements the topic of data variability relates to the question of if point measurements are representative for the barn average. All measurement devices were mounted in such a way that they were as much as possible exposed to free inflow in order to minimize systematic errors induced by the construction material of the barns (e.g., wind shading or conduction). Moreover, to reduce the spatial and temporal variability in the relevant variables, we focused our modeling on an hourly averaged value. Direct air movement and turbulent diffusion, which are mainly responsible for the high spatial variability, can not be resolved on hourly timescale, which justifies also our choice of focusing on spatial averages over the whole barn.
The calibration data used for our statistical indoor models differed in homogeneity and extent between the individual barns. The most comprehensive data set was the one for the reference barn Groß Kreutz where wind, temperature and humidity were measured at about 3 m height approximately every 10 m. In contrast, in the reference barns Dummerstorf and Bétera the spatial resolution of the measurements and the spatial coverage of individual barn locations changed over the measurement periods and differed between the variables. This introduces additional uncertainty in the spatial averages. In addition, three vertical indoor profiles for temperature and relative humidity were incorporated into the spatial averaging in Groß Kreutz, which were not available for the other barns. The observed vertical gradients in temperature and relative humidity are, however, much smaller than the horizontal variability. Thus, the effect of this additional data can be neglected for the total barn average.
Preceding studies indicated that there is a high degree of turbulence yielding to significant spatial inhomogeneities in the velocity field inside the barn (Fiedler et al., 2014; Yi et al., 2018). Depending on the opening sizes of the inlets, eddies of different sizes propagate towards the outlets (Hempel et al., 2015a; Yi et al., 2018). The spatial spreading of the wind speed increases typically with the average wind speed (i.e., for the barns under consideration). This means the spatial variability in the wind depends on the actual inflow speed. Considering the median of the distribution of the observed hourly averaged wind speed values, the typical spatial wind speed variance is approximately 2.4 m s−1. The anticipated changes in the near-surface wind, which governs the inflow, are, however, regionally very diverse (Kjellström et al., 2018).
Considering the threshold ETIC =20 (as used in our study), a decrease in the wind speed from 2.4 to 0 m s−1 results in an increase in the ETIC value between approximately 1.5 (for very low relative humidity) and 4 for very high humidity. This means under arid climate cows in some locations of the barn, which are particularly exposed to the wind, will only exceed the threshold for mild stress, while others in calm locations suffer from already moderate stress. Under humid climate, the effect is even stronger as cows in locations that are particularly exposed to the wind may not even be under heat stress at all (ETIC with wind approximately 16 instead of 20), while others are suffering from already moderate heat stress.
The inhomogeneous distribution of heat and humidity sources, related to farm management and the turbulent inflow associated with the meteorological boundary conditions, yield also high spatial and temporal variability in air temperature (approximately ±2 ∘C) and relative humidity (up to ±20 % relative humidity) (Herbut et al., 2015; Hempel et al., 2018). For THI values close to the threshold of 72, each of those uncertainty values corresponds approximately to ±2 THI units. However, this estimated spatial variability refers to measurements with a temporal resolution of 5 to 10 min.
However, it has to be noted that the spatial variability in the THI inside the barn can be up to ±4 THI units from the projected average value (considering the spatial variation in temperature and humidity as independent of each other). This is almost a difference of one THI class, which implies that events classified as moderate based on the spatial average might correspond to already severe heat stress in some locations and only mild stress in other parts of the building.
3.4 Projected impacts and adaption options
The anticipated increase in the number and duration of heat stress events will have significant impacts and implies a strong need for adaptation measures for the European dairy husbandry system due to economic, environmental and ethical (animal welfare) aspects.
3.4.1 Economic impact
Heat stress affects the reproductive performance of cows and decreases fertility (De Rensis et al., 2015; Schüller, 2015). In addition, elevated temperatures may increase disease pressure and lead on to more health treatment (see Sect. 3.4.3). In particular, the occurrence of heat stress events can be translated into losses in milk yield and quality, where the decline of milk yield begins directly after being exposed to uncomfortable environmental conditions (Rushen et al., 2001). In literature it is often assumed that milk yield stays almost constant until a certain threshold and then linearly declines with increasing degree of THI (Ravagnolo and Misztal, 2000; Bohmanova et al., 2007). The decline rate per cow and day per THI unit with the onset of heat stress has been estimated for Holstein dairy cattle (the breed in our reference barns) to be, for example, between 0.3 and 0.39 kg for cows with 28 kg daily milk yield in the US and around 0.41 kg for cows with 20 kg milk yield in the Mediterranean region (Bouraoui et al., 2002; Bohmanova et al., 2007). These cows can be considered average-producing cows. Higher-yielding cows are known to be more susceptible to heat stress (Kadzere et al., 2002; Nardone et al., 2010; West, 2003). It has been shown that at the same THI threshold the most productive cows (yield average 42.5 kg d−1) of the same Holstein breed lost 0.174 kg d−1 per unit of THI more than the average cows (31.5 kg d−1) (Carabano et al., 2016). As the average milk yield of the cows in our focus regions is higher than in the mentioned studies about milk-yield depression (approximately 35 to 45 kg d−1 milk yield), it is reasonable to scale the decline rates accordingly leading to an excepted decline range between 0.474 and 0.584 kg d−1 per THI unit. As a consequence, we assumed an average decline of approximately 0.5 kg d−1 and per cow for each THI unit above the heat stress threshold. That means 2.0 kg less milk per day and per cow for each additional day with moderate heat stress can be expected (see Sect. 2.6).
Table 6The number of heat stress events (HSE) and their average duration (HSED) based on the projections under RCP 8.5 were considered. The number of heat stress days (HSD) was estimated as the ratio HSE/HSED assuming one period of consecutive heat stress hours per day. Milk-yield loss (MYL) per country was extrapolated for the countries where the reference barns are located and given relative to a reference milk yield. The assumed total amount of cows was 4.2×10⁶ in Germany and 0.8×10⁶ in Spain (2017 level according to http://de.statistica.com/). For Germany half of the cows were allocated to the projected change for the reference barn Groß Kreutz and the other half to the reference barn Dummerstorf. A reference annual European milk yield of 168×106 t was assumed (see the Introduction section).

Our results imply an increase of, on average, approximately 120 heat stress days with THI ≥72 by the end of the century (see Table 6). Eventually, the estimated milk-yield losses in Germany and Spain, where our reference barns were located, accumulate to approximately 0.68 % of the annual European milk yield today, which is approximately 168×106 t (see Table 6). As Germany and Spain provide together approximately 24 % of the European milk yield, assuming our reference barns and the focus regions to be representative for the average change of heat stress events in Europe, the total loss can be extrapolated to be about 2.8 % of the annual milk yield today under the RCP 8.5 scenario.
In addition to the milk yield, a decrease in the milk fat (approximately 0.34 % to 0.4 %) and protein (approximately 0.08 % to 0.2 %) contents (with milk fat content typically around 3.5 % and milk protein content typically around 2.9 %) can be expected according to literature (Bouraoui et al., 2002; Collier et al., 2012; Carabano et al., 2016). Under contemporary market conditions, higher percentages of fat and proteins increase the milk price (Bailey et al., 2005). The amount of these price corrections depends on the local markets. In addition to losing these potential bonuses, low fat and protein contents increase the risk of rejection from the buyer of the milk lot.
Heat stress events and thus financial losses are concentrated in the summer. An increase of 120 additional heat stress days per year, at least half of which are expected to occur in summer, implies that in each summer month approximately 20 additional heat stress days can be expected, thus affecting liquidity of farms in summer. In the worst summer month, farmers may lose approximately EUR 14 per cow assuming an average milk price of EUR 0.35 per kilogram of milk. With our estimates, a month with mild stress would be equivalent to losing 5.4 % of the monthly income. For an average farm in Germany and Spain that would involve losing 30 % and 26 %, respectively, of the monthly farm gross margin without coupled payments from the year 2016. This yields particular challenges for the survival of dairy specialized farms, of which only 2 % and 21 % in Germany and Spain, respectively, have positive net economic margin (European Commission – EU FADN, 2018).
Finally, in countries with already pronounced hot summer periods, like in the Mediterranean region where farms already manage calving seasonally in order to avoid the lower summer fertility rates, the increase in the number of heat stress events in spring or autumn may be particularly damaging.
3.4.2 Environmental impact
Lower productivity per cow, as expected under heat stress (see Sect. 3.4.1), has been linked with increased ammonia emission intensity in the literature (Groenestein et al., 2019; Sajeev et al., 2018; Sanchis et al., 2019). The ammonia release from manure increases with temperature by approximately 1.5 g. Hence, the increase in heat stress events can be translated into the number of hours with at least 4.5 g per cow and per day higher ammonia emissions. With approximately 120 more heat stress days (see estimation in Sect. 3.4.1), 540 g per cow and per year (which is about 106 mg per barn and per year) higher ammonia emissions can be expected as a result of climate change. With around 30×106 dairy cattle in Europe this would pile up to additional annual ammonia emissions from European dairy cattle husbandry of about 16 Gg yr−1 (i.e., approximately 2.9 % (550 Gg) of the German and 4.5 % (353 Gg) of the Spanish, or 0.4 % (3624 Gg) of the EU-28, national emission ceilings (NEC) target; see https://www.eea.europa.eu, last access: 11 April 2019). This implies further impacts as ammonia contributes to the formation of secondary particulate matter, which is relevant to respiratory health issues and the Earth's radiation budget (Lelieveld et al., 2015). Moreover, ammonia reacts to chemical compounds that lead to acidification of soil and water (Sutton et al., 2013).
Table 7The change in methane release (corresponding to annual emissions) is estimated as the product of the average livestock unit (LUavg) in the barn and the estimated number of additional heat stress events (HSE). A 1 g LU−1 h−1 higher methane emission during heat stress conditions is assumed (Hempel et al., 2016b). The average livestock unit of the reference barns was estimated as the number of animals in the barn times 500 kg divided by the average body weight. Considering a total mass of the Earth's atmosphere of approximately 5×10²¹ g, this methane release was converted into a concentration increase, neglecting other processes that affect the methane concentration (Trenberth and Smith, 2005).
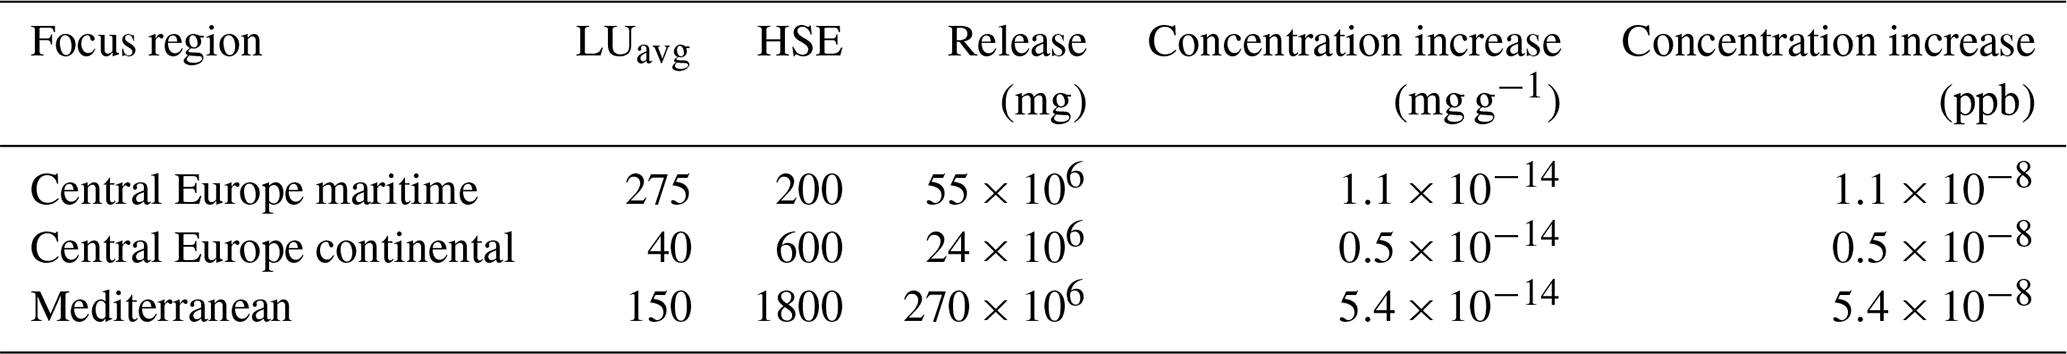
Besides ammonia, the emission of greenhouse gases, particularly methane, is a crucial topic. Although its average atmospheric concentration is only a small fraction of that of carbon dioxide (1800 ppb compared to 390 ppm), methane is initially far more harmful (Pachauri et al., 2014). Methane production by ruminants is associated with microbial fermentation of hydrolyzed carbohydrates and influenced by many factors including the ambient temperature (Broucek, 2014). An optimal ambient temperature (i.e., no climatic stress) corresponds to minimal methane emissions from dairy cattle, while each heat stress event is expected to lead to a few grams per livestock unit and per hour higher methane emissions (Hempel et al., 2016b). In addition, the higher temperatures will yield a considerable increase in methane emissions from manure (particularly liquid manure) (Amon et al., 2007). The total methane increase implies a positive feedback loop as the increased methane concentration in the atmosphere will contribute to an acceleration of climate change. Based on the expected increase in the number of heat stress events, the impact of heat stress on methane emissions is about 106 mg yr−1 per dairy barn (see Table 7). With around 30×106 dairy cattle in Europe and assuming an average barn size of 200 cattle, this corresponds to an increase of approximately 0.15 Gg yr−1 (i.e., on average about 10−3 ppb higher methane concentrations).
3.4.3 Welfare impact
Heat stress introduces some physiological impacts as cattle try to adapt themselves by increasing respiration rate (panting in extreme situations) and reducing milk yield and reproductive performance as well as by changing the feeding behavior, decreasing activity and increasing standing time (De Rensis and Scaramuzzi, 2003; West, 2003; Schütz et al., 2008; Dikmen and Hansen, 2009). Behavior, health and productivity provide information to evaluate the welfare.
The respiration rate, measured in breaths per minute (bpm), is particularly valuable to evaluate instantaneous heat stress as it is affected by the ambient conditions with little or no time lag (Pinto et al., 2019a; Galán et al., 2018; Brown-Brandl et al., 2005). While under thermoneutral conditions the respiration rate ranges from 15 to 36 bpm, high-yielding dairy cattle tend to increase their respiration rate by 27 to 39 bpm if THI increases from THI ≤68 to THI ≥80 (i.e., 2–4 bpm per THI unit) (Dirksen et al., 1990; Jackson and Cockcroft, 2008; Pinto et al., 2019b; Berman et al., 1985; Ominski et al., 2002). As a consequence, based on our results an increase of approximately 9 bpm (i.e., 25 % to 60 % relative to the normal respiration rate) can be expected under RCP 8.5 during one-tenth of all hours of a year or one-fourth of all summer hours in addition to the current situation in the reference barns in our focus regions. The initial response is, however, part of a homeostatic mechanism which, besides increased respiration rate, includes also increased water intake, increased loss of body fluids due to sweating and panting, reduction in fecal and urinary water losses, reduced feed intake, and increased heart rate during short-term exposure to heat (Kadzere et al., 2002). If the heat stress persists, the muscles of the animal tend to fatigue and the respiration rate tends to decrease again for a short time. Thus, with persisting heat load accumulation, the respiration rate will level off at an intermediate value which can, however, still be considerably above the normal state. These changes promote diseases, such as disorders of the acid–base budget (alkalosis), which increase the probability for medical treatments, and in the long term may negatively affect longevity (West, 2003).
The most common behavioral indicator for heat stress is the time spent standing, where the lying posture is considered a cow comfort indicator (Galán et al., 2018; Acatincăi et al., 2010; Herbut and Angrecka, 2018). The average daily lying time decreases by approximately 10 to 20 min per THI unit under heat stress conditions, resulting in an increase in the standing time on the same order of magnitude to improve the wind convection and thus increase the heat dissipation (Cook et al., 2007; Allen et al., 2015; Heinicke et al., 2018). This increased standing time is an effect of aggregated heat stress events and is typically associated with daily averaged THI. Our results imply approximately 120 additional heat stress days with prolonged periods of THI ≥72 (i.e., nearly one-third of the year). At each of those days an approximately 1 h longer standing time can be expected. This significantly contributes to a higher risk of lameness (Cook et al., 2007; Allen et al., 2013).
The changes in the average duration of heat stress events further imply that in the Mediterranean region cattle are potentially under permanent heat stress in summer. Especially during the night, the decrease in the ambient temperature is too low for recovering (Polsky and von Keyserlingk, 2017). Hence, a behavioral adaption in terms of shifting activity towards non-heat-stress hours might become impossible. Although short-term adaptation of the physiology of the cows might be supported by the increased duration to some degree, the effect of the daily heat load duration amplifies the effect of the average daily THI up to a point at which the cows can not further adapt their activity changes (Heinicke et al., 2018, 2019). As a consequence milk yield is expected to decrease significantly if no additional cooling is provided.
It has to be noted that dairy husbandry in the Mediterranean region, as well as in countries in Middle Eastern or tropical regions, is already faced with extended periods of heat load conditions during the year (Honig et al., 2012; da Costa et al., 2015; Ortiz et al., 2015). The associated reactions to heat stress conditions have a strong genetic component (Broucek et al., 2007; Bernabucci et al., 2014). If climate changes slow enough, dairy herds will genetically adapt by nature to some degree to the elevated temperatures. In addition, most of the hot countries already search actively for adaptation measures to alleviate the cows’ heat stress (see Sect. 3.4.4). Those measures include, for example, promoting cross breeds adapted to the heat load conditions (da Costa et al., 2015) and evaporative cooling systems to provide refreshment for the cows, especially during the day when the environment temperature is particularly high (Honig et al., 2012; Ortiz et al., 2015; Pinto et al., 2019a; Broucek et al., 2007). These efforts need to be further intensified in the future.
3.4.4 Adaptation options for animal housing
Moderate changes in the heat stress risk can be addressed by short-term measures which optimize the already implemented control mechanisms such as shading, fans, adjustable opening, or cow showers and fogging devices (St-Pierre et al., 2003; Galán et al., 2018; Davison et al., 2016; Polsky and von Keyserlingk, 2017; Honig et al., 2012; Anderson et al., 2013; Valtorta and Gallardo, 2004). Depending on the boundary conditions some of those measures may become more suitable than others.
If the annual variability in temperature is rather small and the overall heat stress risk is high, such as in Mediterranean regions, open barns can be considered an adaptation measure. Under such conditions, as in the example of the reference barn Bétera, natural ventilation offers almost no possibility for further adaptation by adjusting the opening configurations. In such buildings, fans and showers or fogging devices have been implemented in the past to alleviate the heat load and enable high milk yields during hot periods (Ortiz et al., 2015; Fournel et al., 2017). The fans can in principle decrease or increase the air speed in the animal-occupied zone as they induce a flow that can be aligned or opposed to the naturally induced flow (Anderson et al., 2013). The speed and direction of the fan-induced flow could be optimized via velocity measurements inside the barns. High relative humidity can additionally promote the cooling via the air flow. Similarly, showering and fogging contribute to the reduction in heat stress, particularly under dry weather conditions. If the ambient relative humidity is already high these measures are less efficient, but it has been shown that frequent showering can be still valuable (Honig et al., 2012). In terms of costs and benefits, recurring cooling sessions instead of constant cooling are reasonable, where the number of sessions is an important factor (Pinto et al., 2019c). With increasing temperatures and decreasing humidity (as projected in our study; see Fig. 3) frequent showering, as common for example in the Israeli husbandry system, might become more valuable for the western Mediterranean region.
For the central European regions, in general the cooling by showering and fogging can be expected to be less efficient than in the Mediterranean region due to the higher relative humidity. However, as hot and dry periods are expected to become more frequent, such devices can still be a valuable investment (, ). Smart regulation of the fans and the opening configurations will be, however, even more valuable. The position of curtains and the opening ratio have a crucial impact on the flow pattern and the air speed in the animal-occupied zone. It has been shown that the average horizontal velocity in the animal-occupied zone could be varied in a range of −4 % up to 70 % of the incident flow velocity (Yi et al., 2018). This can reduce emissions, because the airflow can be controlled precisely and the overflowing of emission-active surfaces can be minimized. Moreover, the local air exchange rates in the animal-occupied zones can be significantly improved.
As a mid-term adaption strategy, a sensor-based control of openings, fans and fogging devices should be implemented, including a smart control of the fogging times governed by the actual relative humidity. Active cooling may involve also the use of tubes for targeted supply of (potentially pre-cooled) air in the animal-occupied zone. The speed and orientation of the mechanical ventilation support (e.g., by fans or tubes) should be regulated automatically based on wind speed measurements in the barn. In addition, further improvement of the roof insulation and the use of cooling pads in the cubicles may reduce the thermal load. The number and timing of the cooling sessions, the operation of the fans or tubes, and the control of the curtains should be based on cow-specific indicators such as respiration rate or body temperature. In this context, respiration rate is the more direct indicator, but it is much harder to measure automatically at the moment (Strutzke et al., 2018).
Finally, considering the large probability of highly increasing heat stress risk by the end of the century, the investment in hybrid ventilation systems for cattle husbandry might become valuable. An engineering solution of a precision air supply system with additional mechanical ventilation could provide a better local thermal environment for cows and remove considerably more heat from the animals than currently available systems, especially under calm conditions (Wang et al., 2018c). Such a system may be combined with smart fogging devices and air flushing systems as well as adjustable opening configurations and a number of fans permitting operators to switch between natural ventilation, mechanically supported natural ventilation and mechanical ventilation in a smart, automated way.
Our study shows that the annual average temperature significantly increases inside the barns in our focus regions, while the relative humidity shows a decreasing trend and the wind shows no or a weakly increasing trend. Although decreasing humidity and increasing wind speed in general alleviate the heat load, the elevated temperatures lead to a considerable increase in the heat stress risk reflected by an increase in the number (additionally up to 21 % of all hours of a year) and the duration of heat stress events (up to 17 h prolonged). The heat stress risk and the magnitude of subsequent impacts differ regionally due to different offsets and seasonal variability, depending on the assumed radiative forcing and the driving climate model. Nevertheless, considerable socioeconomic and environmental impacts must be expected.
For example, we estimated an increase in the respiration rate of up to 60 % during one-tenth of all hours of a year and up to 1 h prolonged standing times at one-third of the days, which promotes health issues and increases the probability of medical treatments. This implies additional costs for the farmers. At the same time, milk yield was estimated to decrease by about 2.8 % relative to the present European milk yield. As a consequence, farmers may expect financial losses particularly during the summer season of about 5.4 % of the monthly income. In addition, an increasing demand for emission reduction measures must be expected. We estimated that an emission increase of about 16 Gg of ammonia per year and 0.1 Gg of methane per year can be expected, implying feedback loops in the climate system which are presently underexplored.
The multiple impacts highlight the urgent need for an adaptation of the husbandry system. The most common approach is the adaptation of housing. For example, short-term measures which optimize the already implemented control mechanisms in dairy cattle buildings such as fans, air flushing systems with active cooling, adjustable openings, cow showers and fogging devices can be valuable. Furthermore, smart and automated control systems based on animal-associated sensors can substantially increase the efficiency of those devices and alleviate the impacts.
Our impact assessment demonstrated the diversity and complexity of climate change impacts on dairy cattle. We estimated the order of magnitude of potential impacts of heat stress in the European dairy cattle husbandry system. However, the presented impacts were estimated based on a variety of simplifications implying that further quantitative studies on the direct and indirect economic, environmental and ethical (i.e., animal welfare aspects) impacts are required. This includes, for example, research on the dependency of ammonia, methane and other pollutant emissions on the ambient conditions (such as air temperature) as well as the building design and management. Moreover, the relation between heat-stress-induced physiological and behavioral changes, health issues, and medical treatments must be investigated in more detail. In addition, scenarios for future adaptation (e.g., breeding, housing, feeding, acclimatization) and future milk yields and milk prices should be further developed and included in forthcoming studies. The same applies to the accumulation of heat stress impacts with increasing duration of heat load and differentiated by heat stress levels (e.g., mild, moderate, severe) and breed.
Our heat stress projections and the subsequent impact assessment were based on several models that involved different levels of uncertainty. The uncertainty analysis revealed knowledge gaps that require further detailed research in the future involving, for example, studies about the refinement of regional climate model projections, particularly in regard to changes in the wind regime. Moreover, feedback loops related to the radiative forcing, which are implied by an emission increase with temperature rise, should be investigated further. This includes, for example, the accelerated increase of atmospheric methane concentration or ammonia-induced formation of particulate matter. It also involves detailed research on the accuracy and representativeness of measurements of agricultural emissions. Furthermore, in-depth understanding of animal-specific heat stress thresholds dependent on activity and vitality and posture and position instead of herd- and barn-averaged indices and thresholds is required.
Finally, future research must incorporate the further development and refinement of indoor climate models. This applies to the statistical as well as dynamical approaches such as Reynolds-averaged Navier–Stokes (RANS), large eddy simulation (LES) and direct numerical simulation (DNS) for naturally ventilated barns. The applicability of statistical models under climate change conditions is per se limited. Hence, a generalization and extrapolation to other regions and climate zones including cross-validation with further measurement data and simulations of dynamical indoor models would be valuable to evaluate possible adaptation and mitigation strategies in future studies.
The meteorological data (obsevations and simulations) used in this study are published in the repository of Mendeley Data (Hempel and Menz, 2019).
| GCM | global climate model – general circulation model to describe climate behavior by integrating a variety of fluid dynamical and chemical equations that are derived directly from physical laws or constructed by empirical means |
| RCM | regional climate model – numeric climate prediction model forced by specified lateral and ocean conditions from a GCM or observation-based data set that accounts for high-resolution topographical data, land-sea contrasts and surface characteristics |
| RCP | representative concentration pathway – greenhouse gas concentration trajectory which describes climate futures with a particular radiative forcing value in the year 2100 |
| ReLU | rectified linear unit – activation function in neuronal networks defined as the positive part of its argument |
| THI | temperature humidity index – empirical model to evaluate the thermal environment as a function of air temperature and humidity |
| ETIC | equivalent temperature index for cattle – empirical model to evaluate the thermal environment as a function of air temperature, humidity, air speed and radiation |
| HSE | heat stress events – number of consecutive hours of at least moderate heat stress as defined by a THI or ETIC thresholds |
| HSED | heat stress event duration – length of periods of consecutive hours of at least moderate heat stress |
| HSE | number of heat stress days – amount of days with hours of at least moderate heat stress (approximated by HSE/HSED) |
| NEC | national emission ceilings – European directive which sets national reduction commitments for pollutants which lead to significant negative impacts on human health and the environment |
SH made major contributions to the general setup of the study, the conception of the article, the data analysis and the writing process (original draft, review and editing) in all sections, and they contributed to the on-farm measurements and data curation. CM made major contributions to the general setup of the study, the conception of the article, the data curation, the model development and the visualization, and they contributed to the writing process (original draft, review and editing) in all sections. SP contributed to the general setup of the study, the on-farm measurements and the writing process (original draft, review and editing) with major contributions on stress indices and welfare impacts. EG contributed to the general setup of the study and the writing process (original draft, review and editing) with contributions to welfare impacts and adaptation and major contributions on economic impacts. DJ contributed to the general setup of the study, the on-farm measurements, the data curation and the writing process (original draft, review and editing) with major contributions to adaptation. FE contributed to the general setup of the study, the on-farm measurements and the writing process (review and editing) with a focus on environmental impacts. TMS contributed to the general setup of the study, the on-farm measurements and the writing process (review and editing) with a focus on stress indices and welfare impacts. XW contributed to the writing process (review and editing) with a focus on methods and adaptation. JH contributed to the on-farm measurements and the writing process (review and editing) with a focus on stress indices and welfare. GZ contributed to the general setup of the study and the writing process (review and editing) with a focus on adaptation. BA contributed to the general setup of the study and the writing process (review and editing) with a focus on the impacts. AdP contributed to the general setup of the study and the writing process (review and editing) with a focus on economics. TA contributed to the general setup of the study and the writing process (review and editing).
The authors declare that they have no conflict of interest.
This study was conducted in the framework of the OptiBarn project in the FACCE ERANET+ initiative on climate smart agriculture. We thank the governments of Germany, Spain and Denmark for providing funding for this research.
We thank Klaus Parr, Detlef May and Ramón Morla for permitting us to conduct the on-farm measurements and Carola Franke (LVAT) for her assistance in managing and scheduling the intensive on-farm measurements in the Groß Kreutz barn.
We further thank Knut Schröter, Ulrich Stollberg and Andreas Reinhardt, technicians at ATB, for supporting the implementation of the on-farm measurements.
We further thank the ReKliEs-De project (funded by German Ministry of Education and Research, grant 01LK1401) team for provide us with the RCM simulations used within this study.
This research has been supported by the German Federal Ministry of Food and Agriculture (BMEL) through the Federal Office for Agriculture and Food (BLE) (grant nos. 2814ERA02C and 2814ERA03C), the Instituto Nacional de Investigación Tecnología Agraria y Alimentaria (INIA) (grant no. 618105), the Basque Government (grant no. BERC 2018–2021), the Spanish Ministry of Economy, Industry and Competitiveness MINECO (grant nos. MDM-2017-0714, FJCI-2016-30263, and RYC-2017-22143), and the Innovation Foundation Denmark (grant no. 4215-00004B).
The publication of this article was funded by the
Open Access Fund of the Leibniz Association.
This paper was edited by Sagnik Dey and reviewed by Grant Dewell and Alsaied Habeeb.
Acatincăi, S., Gavojdian, D., Stanciu, G., Cziszter, L. T., Tripon, I., and Baul, S.: Study Regarding Rumination Behavior in Cattle–Position Adopted by Cows During Rumination Process, Scientific Papers Animal Science and Biotechnologies, 43, 199–202, 2010. a
Allen, J., Anderson, S., Collier, R., and Smith, J.: Managing heat stress and its impact on cow behavior, in: 28th Annual Southwest Nutrition and Management Conference, 6–8 March 2013, Reno, Nevada, USA, 2013. a
Allen, J., Hall, L., Collier, R., and Smith, J.: Effect of core body temperature, time of day, and climate conditions on behavioral patterns of lactating dairy cows experiencing mild to moderate heat stress, J. Dairy Sci., 98, 118–127, 2015. a, b
Amon, B., Kryvoruchko, V., Fröhlich, M., Amon, T., Pöllinger, A., Mösenbacher, I., and Hausleitner, A.: Ammonia and greenhouse gas emissions from a straw flow system for fattening pigs: Housing and manure storage, Livest. Sci., 112, 199–207, 2007. a
Anderson, S., Bradford, B., Harner, J., Tucker, C., Choi, C., Allen, J., Hall, L., Rungruang, S., Collier, R., and Smith, J.: Effects of adjustable and stationary fans with misters on core body temperature and lying behavior of lactating dairy cows in a semiarid climate, J. Dairy Sci., 96, 4738–4750, 2013. a, b
Angrecka, S. and Herbut, P.: Conditions for cold stress development in dairy cattle kept in free stall barn during severe frosts, Czech J. Anim. Sci., 60, 81–87, https://doi.org/10.17221/7978-CJAS, 2015. a
Bailey, K., Jones, C., and Heinrichs, A.: Economic returns to Holstein and Jersey herds under multiple component pricing, J. Dairy Sci., 88, 2269–2280, 2005. a
Berman, A.: Estimates of heat stress relief needs for Holstein dairy cows 1, J. Anim. Sci., 83, 1377–1384, 2005. a
Berman, A., Folman, Y., Kaim, M., Mamen, M., Herz, Z., Wolfenson, D., Arieli, A., and Graber, Y.: Upper critical temperatures and forced ventilation effects for high-yielding dairy cows in a subtropical climate, J. Dairy Sci., 68, 1488–1495, 1985. a
Bernabucci, U., Biffani, S., Buggiotti, L., Vitali, A., Lacetera, N., and Nardone, A.: The effects of heat stress in Italian Holstein dairy cattle, J. Dairy Sci., 97, 471–486, 2014. a, b
Bianca, W.: Relative importance of dry- and wet-bulb temperatures in causing heat stress in cattle, Nature, 195, 251–252, 1962. a
Bohmanova, J., Misztal, I., and Cole, J.: Temperature-humidity indices as indicators of milk production losses due to heat stress, J. Dairy Sci., 90, 1947–1956, 2007. a, b, c, d
Bouraoui, R., Lahmar, M., Majdoub, A., Djemali, M., and Belyea, R.: The relationship of temperature-humidity index with milk production of dairy cows in a Mediterranean climate, Anim. Res., 51, 479–491, 2002. a, b
Broucek, J.: Production of methane emissions from ruminant husbandry: a review, J. Environ. Prot., 5, 1482–1493, https://doi.org/10.4236/jep.2014.515141, 2014. a
Brouček, J., Letkovičová, M., and Kovalčuj, K.: Estimation of cold stress effect on dairy cows, Int. J. Biometeorol., 35, 29–32, 1991. a
Broucek, J., Ryba, S., Mihina, S., Uhrincat, M., and Kisac, P.: Impact of thermal-humidity index on milk yield under conditions of different dairy management, J. Anim. Feed Sci., 16, 329–344, https://doi.org/10.22358/jafs/66755/2007, 2007. a, b
Brown-Brandl, T., Eigenberg, R., Nienaber, J., and Hahn, G. L.: Dynamic response indicators of heat stress in shaded and non-shaded feedlot cattle, Part 1: Analyses of indicators, Biosyst. Eng., 90, 451–462, 2005. a
Brügemann, K., Gernand, E., König von Borstel, U., and König, S.: Defining and evaluating heat stress thresholds in different dairy cow production systems, Arch. Anim. Breed., 55, 13–24, 2012. a
Cannon, A. J.: Multivariate quantile mapping bias correction: an N-dimensional probability density function transform for climate model simulations of multiple variables, Clim. Dynam., 50, 31–49, https://doi.org/10.1007/s00382-017-3580-6, 2018. a
Carabano, M.-J., Logar, B., Bormann, J., Minet, J., Vanrobays, M.-L., Diaz, C., Tychon, B., Gengler, N., and Hammami, H.: Modeling heat stress under different environmental conditions, J. Dairy Sci., 99, 3798–3814, 2016. a, b, c
Christensen, J., Hewitson, B., Busuioc, A., Chen, A., Gao, X., Held, I., Jones, R., Kolli, R., Kwon, W.-T., Laprise, R., Magaña Rueda, V., Mearns, L., Menéndez, C., Räisänen, J., Rinke, A., Sarr, A., and Whetton, P.: Regional Climate Projections, in: IPCC Climate Change 2007: The Physical Science Basis, edited by: Solomon, S., Qin, D., Manning, M., Hen, Z., Marquis, M., Averyt, K., Tignor, M., and Miller, H., Cambridge University Press, Cambridge, UK and New York, NY, USA, 2007. a
Collier, R. J., Hall, L. W., Rungruang, S., and Zimbleman, R. B.: Quantifying heat stress and its impact on metabolism and performance, Proc. Florida Ruminant Nutrition Symp, Department of Animal Sciences, University of Arizona, Gainesville, USA, p. 68, 2012. a, b, c
Cook, N., Mentink, R., Bennett, T., and Burgi, K.: The effect of heat stress and lameness on time budgets of lactating dairy cows, J. Dairy Sci., 90, 1674–1682, 2007. a, b
Curtis, A., Scharf, B., Eichen, P., and Spiers, D.: Relationships between ambient conditions, thermal status, and feed intake of cattle during summer heat stress with access to shade, J. Therm. Biol., 63, 104–111, 2017. a
da Costa, A. N. L., Feitosa, J. V., Montezuma, P. A., de Souza, P. T., and de Araújo, A. A.: Rectal temperatures, respiratory rates, production, and reproduction performances of crossbred Girolando cows under heat stress in northeastern Brazil, Int. J. Biometeorol., 59, 1647–1653, 2015. a, b
Da Silva, R. G., Maia, A. S. C., and de Macedo Costa, L. L.: Index of thermal stress for cows (ITSC) under high solar radiation in tropical environments, Int. J. Biometeorol., 59, 551–559, 2015. a
Davison, T., Jonsson, N., Mayer, D., Gaughan, J., Ehrlich, W., and McGowan, M.: Comparison of the impact of six heat-load management strategies on thermal responses and milk production of feed-pad and pasture fed dairy cows in a subtropical environment, Int. J. Biometeorol., 60, 1961–1968, 2016. a
Del Prado A., Scholefield D., Chadwick D., Misselbrook T., Haygarth P., Hopkins A., Dewhurst R., Jones R., Moorby J., Davison P., Lord E., Turner M., Aikman P., and Schröder J.: A modelling framework to identify new integrated dairy production systems, in: 21st General Meeting of the European Grassland Federation (EGF), 3–6 April 2006, Badajoz, Spain, 766–768, 2006. a
De Rensis, F. and Scaramuzzi, R. J.: Heat stress and seasonal effects on reproduction in the dairy cow – a review, Theriogenology, 60, 1139–1151, 2003. a
De Rensis, F., Garcia-Ispierto, I., and López-Gatius, F.: Seasonal heat stress: Clinical implications and hormone treatments for the fertility of dairy cows, Theriogenology, 84, 659–666, 2015. a
Diepen, C. v., Wolf, J., Keulen, H. V., and Rappoldt, C.: WOFOST: a simulation model of crop production, Soil Use Manage., 5, 16–24, 1989. a
Dikmen, S. and Hansen, P.: Is the temperature-humidity index the best indicator of heat stress in lactating dairy cows in a subtropical environment?, J. Dairy Sci., 92, 109–116, 2009. a, b
Dirksen, G., Gründer, H., Grunert, E., Krause, D., and Stöber, M.: Clinical examination of cattle, 3rd edn., Verlag Paul Parey, Berlin, Germany, 1990. a
Dosio, A.: Projections of climate change indices of temperature and precipitation from an ensemble of bias-adjusted high-resolution EURO-CORDEX regional climate models, J. Geophys. Res.-Atmos., 121, 5488–5511, 2016. a
Efron, B.: Bootstrap Methods: Another Look at the Jackknife, Ann. Stat., 7, 1–26, https://doi.org/10.1214/aos/1176344552, 1979. a
Efron, B. and Tibshirani, R.: Bootstrap Methods for Standard Errors, Confidence Intervals, and Other Measures of Statistical Accuracy, Stat. Sci., 1, 54–75, https://doi.org/10.1214/ss/1177013815, 1986. a
European Commission – EU FADN: EU Dairy Farms Report Based on 2016 FADN Data, avaialble at: https://ec.europa.eu/agriculture/fadn_en (last access: 11 April 2019), 2018. a
Fiedler, A., Fischer, J., Hempel, S., Saha, C., Loebsin, C., Berg, W., Amon, B., Brunsch, R., and Amon, T.: Flow fields within a dairy barn – Measurements, physical modelling and numerical simulation, in: Proceedings of the International Conference of Agricultural Engineering AgEng, 6–10 July 2014, Zürich, Switzerland, 1–5, 2014. a, b
Food and Agriculture Organization of the United Nations (FAO): The Impact of Disasters on Agriculture – Assessing the information gap, available at: http://www.fao.org/3/a-i7279e.pdf (last access: 10 September 2018), 2017. a
Ford, B.: An Overview of Hot-Deck Procedures, in: Incomplete Data in Sample Surveys: Theory and Bibliographies, edited by: Madow, W., Olkin, I., and Rubin, D., Academic Press, New York, USA, 1983. a
Fournel, S., Ouellet, V., and Charbonneau, É.: Practices for alleviating heat stress of dairy cows in humid continental climates: a literature review, Animals, 7, 37, https://doi.org/10.3390/ani7050037, 2017. a
Galán, E., Llonch, P., Villagrá, A., Levit, H., Pinto, S., and del Prado, A.: A systematic review of non-productivity-related animal-based indicators of heat stress resilience in dairy cattle, PloS one, 13, e0206520, https://doi.org/10.1371/journal.pone.0206520, 2018. a, b, c, d
Gaughan, J., Mader, T. L., Holt, S., and Lisle, A.: A new heat load index for feedlot cattle, J. Anim. Sci., 86, 226–234, 2008. a
Gebremedhin, K. and Wu, B.: Simulation of flow field of a ventilated and occupied animal space with different inlet and outlet conditions, J. Therm. Biol., 30, 343–353, 2005. a
Giorgi, F. and Gutowski Jr., W. J.: Regional dynamical downscaling and the CORDEX initiative, Annu. Rev. Env. Resour., 40, 467–490, 2015. a
Groenestein, C., Hutchings, N., Haenel, H., Amon, B., Menzi, H., Mikkelsen, M., Misselbrook, T., van Bruggen, C., Kupper, T., and Webb, J.: Comparison of ammonia emissions related to nitrogen use efficiency of livestock production in Europe, J. Clean. Prod., 211, 1162–1170, 2019. a
Gurney, K.: An Introduction to Neural Networks, UCL Press Limited an imprint of Taylor & Francis group, London, UK, 1997. a
Hahn, G.: Dynamic responses of cattle to thermal heat loads, J. Anim. Sci., 77, 10–20, 1999. a
Hammami, H., Carabaño, M.-J., Logar, B., Vanrobays, M.-L., and Gengler, N.: Genotype x Climate interactions for protein yield using four European Holstein Populations, in: Proceedings of 10th World Congress of Genetics Applied to Livestock Production, 17–22 August 2014, Vancouver, Canada, 2014. a
Heaton, J.: Artificial Intelligence for Humans, Volume 3: Deep Learning and Neural Networks, Artificial Intelligence for Humans Series, CreateSpace Independent Publishing Platform, Heaton Research, Inc., Chesterfield, USA, 2015. a
Heinicke, J., Hoffmann, G., Ammon, C., Amon, B., and Amon, T.: Effects of the daily heat load duration exceeding determined heat load thresholds on activity traits of lactating dairy cows, J. Therm. Biol., 77, 67–74, 2018. a, b, c, d
Heinicke, J., Ibscher, S., Belik, V., and Amon, T.: Cow individual activity response to the accumulation of heat load duration, J. Therm. Biol., 82, 23–32, https://doi.org/10.1016/j.jtherbio.2019.03.011, 2019. a
Hempel, S. and Menz, C.: Indoor climate projections for European cattle barns, Mendeley Data, v1, https://doi.org/10.17632/tjp8h523p7.1, 2019. a
Hempel, S., Frieler, K., Warszawski, L., Schewe, J., and Piontek, F.: A trend-preserving bias correction – the ISI-MIP approach, Earth Syst. Dynam., 4, 219–236, https://doi.org/10.5194/esd-4-219-2013, 2013. a
Hempel, S., Wiedemann, L amd Ammon, C., Fiedler, A., Saha, C.and Janke, D. L. C., Fischer, J., Amon, B., Hoffmann, G., Menz, C., Zhang, G., Halachmi, I., Del Prado, A., Estelles, F., Berg, W., Brunsch, R., and Amon, T.: Determine the flow characteristics of naturally ventilated dairy barns to optimize barn climate, in: 12. Tagung: Bau, Technik und Umwelt 2015 in der landwirtschaftlichen Nutztierhaltung, 8–10 September, 2015, KTBL, Darmstadt, Germany, 346–351, 2015a. a
Hempel, S., Wiedemann, L., Ammon, C., Fiedler, M., Saha, C., Loebsin, C., Fischer, J., Berg, W., Brunsch, R., and Amon, T.: Assessment of the through-flow patterns in naturally ventilated dairy barns – Three methods, one complex approach, in: RAMIRAN 2015 – Rural-Urban Symbiosis, edited by: Körner, I., TC-O_16, TUTech Verlag, Hamburg, Germany, Hamburg University of Technology, Germany, 356–359, e-book, 2015b. a
Hempel, S., Janke, D., König, M., Menz, C., Englisch, A., Pinto, S., Sibony, V., Halachmi, I., Rong, L., Zong, C., Zhang, G., Sanchis, E., Estelle, F., Calvet, S., Galan, E., del Prado, A., Ammon, C., Amon, B., and Amon, T.: Integrated modelling to assess optimisation potentials for cattle housing climate, Advances in Animal Biosciences, 7, 261–262, https://doi.org/10.1017/S2040470016000352, 2016a. a, b
Hempel, S., Saha, C. K., Fiedler, M., Berg, W., Hansen, C., Amon, B., and Amon, T.: Non-linear temperature dependency of ammonia and methane emissions from a naturally ventilated dairy barn, Biosyst. Eng., 145, 10–21, 2016b. a, b, c, d
Hempel, S., Menz, C., Halachmi, I., Zhang, G., del Prado, A., Estelles, F., Amon, B., and Amon, T.: Report on FACCE-JPI valorisation meeting, available at: https://www.faccejpi.com/content/download/5161/48933/version/1/file/FACCE-JPI_Synthesis-valorisation-survey-results-FINAL.pdf (last access: 11 April 2019), 2017a. a
Hempel, S., Menz, C., Halachmi, I., Zhang, G., del Prado, A., Estelles, F., Amon, B., and Amon, T.: Report on ERANET+ mid-term meeting, available at: https://www.faccejpi.com/content/download/5163/48955/version/2/file/Projects+booklet_updated+08+May+2017.pdf (last access: 11 April 2019), 2017b. a
Hempel, S., Menz, C., Halachmi, I., Zhang, G., del Prado, A., Estelles, F., Amon, B., and Amon, T.: Report on ERANET+ mid-term meeting, available at: https://www.faccejpi.com/content/download/5295/50720/version/1/file/OptiBarn_presentation_ERA_NET+final+meeting+March18[1].pdf (last access: 11 April 2019), 2017c. a
Hempel, S., König, M., Menz, C., Janke, D., Amon, B., Banhazi, T. M., Estellés, F., and Amon, T.: Uncertainty in the measurement of indoor temperature and humidity in naturally ventilated dairy buildings as influenced by measurement technique and data variability, Biosyst. Eng., 166, 58–75, 2018. a, b, c, d
Herbut, P. and Angrecka, S.: Relationship between THI level and dairy cows’ behaviour during summer period, Ital. J. Anim. Sci., 17, 226–233, 2018. a
Herbut, P., Angrecka, S., Nawalany, G., and Adamczyk, K.: Spatial and temporal distribution of temperature, relative humidity and air velocity in a parallel milking parlour during summer period, Ann. Anim. Sci., 15, 517–526, 2015. a
Hoffmann, I.: Climate change and the characterization, breeding and conservation of animal genetic resources, Anim. Genet., 41, 32–46, 2010. a
Honig, H., Miron, J., Lehrer, H., Jackoby, S., Zachut, M., Zinou, A., Portnick, Y., and Moallem, U.: Performance and welfare of high-yielding dairy cows subjected to 5 or 8 cooling sessions daily under hot and humid climate, J. Dairy Sci., 95, 3736–3742, 2012. a, b, c, d
Hübener, H., Bülow, K., Fooken, C., Früh, B., Hoffmann, P., Höpp, S., Keuler, K., Menz, C., Mohr, V., Radtke, K., Ramthun, H., Spekat, A., Steger, C., Toussaint, F., Warrach-Sagi, K., and Woldt, M.: ReKliEs-De Ergebnisbericht, Tech. rep., World Data Center for Climate (WDCC) at DKRZ, Hamburg, Germany, https://doi.org/10.2312/WDCC/ReKliEsDe_Ergebnisbericht, 2017. a
Hutchings, N., Sommer, S. G., and Jarvis, S.: A model of ammonia volatilization from a grazing livestock farm, Atmos. Environ., 30, 589–599, 1996. a
Jackson, P. and Cockcroft, P.: Clinical examination of farm animals, Wiley-Backwell, Hoboken, USA, 2008. a
Kadzere, C., Murphy, M., Silanikove, N., and Maltz, E.: Heat stress in lactating dairy cows: a review, Livest. Sci., 77, 59–91, 2002. a, b, c, d, e
Kafle, G. K., Joo, H., and Ndegwa, P. M.: Sampling Duration and Frequency for Determining Emission Rates from Naturally Ventilated Dairy Barns, T. ASABE, 61, 681–691, https://doi.org/10.13031/trans.12543, 2018. a
Kendall, P., Nielsen, P., Webster, J., Verkerk, G., Littlejohn, R., and Matthews, L.: The effects of providing shade to lactating dairy cows in a temperate climate, Livest. Sci., 103, 148–157, 2006. a
Kjellström, E., Nikulin, G., Strandberg, G., Christensen, O. B., Jacob, D., Keuler, K., Lenderink, G., van Meijgaard, E., Schär, C., Somot, S., Sørland, S. L., Teichmann, C., and Vautard, R.: European climate change at global mean temperature increases of 1.5 and 2 °C above pre-industrial conditions as simulated by the EURO-CORDEX regional climate models, Earth Syst. Dynam., 9, 459–478, https://doi.org/10.5194/esd-9-459-2018, 2018. a, b
Kurukulasuriya, P. and Rosenthal, S.: Climate change and agriculture: A review of impacts and adaptations, Environment department papers, no. 91, Climate change series, World Bank, Washington, D.C., USA, 2013. a
Lees, J., Lees, A., and Gaughan, J.: Developing a heat load index for lactating dairy cows, Anim. Prod. Sci., 58, 1387–1391, https://doi.org/10.1071/AN17776, 2018. a, b
Lelieveld, J., Evans, J. S., Fnais, M., Giannadaki, D., and Pozzer, A.: The contribution of outdoor air pollution sources to premature mortality on a global scale, Nature, 525, 367–371, 2015. a
Mader, T. L., Davis, M., and Brown-Brandl, T.: Environmental factors influencing heat stress in feedlot cattle, J. Anim. Sci., 84, 712–719, 2006. a, b, c
Mader, T. L., Johnson, L., and Gaughan, J.: A comprehensive index for assessing environmental stress in animals, J. Anim. Sci., 88, 2153–2165, 2010. a
Mendes, L. B., Edouard, N., Ogink, N. W., Van Dooren, H. J. C., Ilda de Fátima, F. T., and Mosquera, J.: Spatial variability of mixing ratios of ammonia and tracer gases in a naturally ventilated dairy cow barn, Biosyst. Eng., 129, 360–369, 2015. a
Monteny, G., Groenestein, C., and Hilhorst, M.: Interactions and coupling between emissions of methane and nitrous oxide from animal husbandry, Nutr. Cycl. Agroecosys., 60, 123–132, 2001. a
Nardone, A., Ronchi, B., Lacetera, N., Ranieri, M. S., and Bernabucci, U.: Effects of climate changes on animal production and sustainability of livestock systems, Livest. Sci., 130, 57–69, 2010. a, b, c
NRC: A guide to environmental research on animals, National Academy of Science, Washington, D.C., USA, 1971. a
Olesen, J. E. and Bindi, M.: Consequences of climate change for European agricultural productivity, land use and policy, Eur. J. Agron., 16, 239–262, 2002. a
Ominski, K., Kennedy, A., Wittenberg, K., and Nia, S. M.: Physiological and production responses to feeding schedule in lactating dairy cows exposed to short-term, moderate heat stress, J. Dairy Sci., 85, 730–737, 2002. a
Ortiz, X., Smith, J., Rojano, F., Choi, C., Bruer, J., Steele, T., Schuring, N., Allen, J., and Collier, R.: Evaluation of conductive cooling of lactating dairy cows under controlled environmental conditions, J. Dairy Sci., 98, 1759–1771, 2015. a, b, c
Pachauri, R. K., Allen, M. R., Barros, V. R., Broome, J., Cramer, W., Christ, R., Church, J. A., Clarke, L., Dahe, Q., Dasgupta, P., Dubash, N. K., Edenhofer, O., Elgizouli, I., Field, C. B., Forster, P., Friedlingstein, P., Fuglestvedt, J., Gomez-Echeverri, L., Hallegatte, S., Hegerl, G., Howden, M., Jiang, K., Jimenez Cisneroz, B., Kattsov, V., Lee, H., Mach, K. J., Marotzke, J., Mastrandrea, M. D., Meyer, L., Minx, J., Mulugetta, Y., O'Brien, K., Oppenheimer, M., Pereira, J. J., Pichs-Madruga, R., Plattner, G. K., Pörtner, H. O., Power, S. B., Preston, B., Ravindranath, N. H., Reisinger, A., Riahi, K., Rusticucci, M., Scholes, R., Seyboth, K., Sokona, Y., Stavins, R., Stocker, T. F., Tschakert, P., van Vuuren, D., and van Ypserle, J. P.: Climate Change 2014: Synthesis Report. Contribution of Working Groups I, II and III to the Fifth Assessment Report of the Intergovernmental Panel on Climate Change, edited by: Pachauri, R. and Meyer, L., Geneva, Switzerland, IPCC, 151 pp., 2014. a, b
Pedersen, S. and Sällvik, K.: Climatization of animal houses. Heat and moisture production at animal and house levels, Research Centre Bygholm, Danish Institute of Agricultural Sciences, Horsens, Denmark, 2002. a
Pinto, S., Levit, H., Müschner-Siemens, T., Hoffmann, G., Ammon, C., Halachmi, I., Heuwieser, W., and Amon, T.: Influence of evaporative cooling on respiration rate of lactating cows under hot climate conditions, in: New Engineering Concepts for Valued Agriculture. European Conference of Agricultural Engineering EurAgEng 2018, Wageningen, the Netherlands, 808–812, 2019a. a, b, c
Pinto, S., Hoffmann, G., Ammon, C., Amon, B., Heuwieser, W., Halachmi, I., Banhazi, T., and Amon, T.: Influence of barn climate, body postures and milk yield on the respiration rate of dairy cows, Ann. Anim. Sci., 19, 469–481, 2019b. a, b
Pinto, S., Hoffmann, G., Ammon, C., Heuwieser, W., Levit, H., Halachmi, I., and Amon, T.: Effect of two cooling frequencies on respiration rate in lactating dairy cows under hot and humid climate conditions, Ann. Anim. Sci., 19, 821–834, https://doi.org/10.2478/aoas-2019-0026, 2019c. a, b
Polsky, L. and von Keyserlingk, M. A.: Invited review: Effects of heat stress on dairy cattle welfare, J. Dairy Sci., 100, 8645–8657, 2017. a, b, c
Queiroz, M. P. G., Naas, I. d. A., and Sampaio, C. A. d. P.: Estimating thermal comfort for piglets considering ammonia concentration, E-journal – CIGR, 7, 05 004/BC 05 005, 1–10, 2005. a
Ravagnolo, O. and Misztal, I.: Genetic component of heat stress in dairy cattle, parameter estimation, J. Dairy Sci., 83, 2126–2130, 2000. a
Rushen, J., Munksgaard, L., Marnet, P., and DePassillé, A.: Human contact and the effects of acute stress on cows at milking, Appl. Anim. Behav. Sci., 73, 1–14, 2001. a
Sajeev, E. P. M., Amon, B., Ammon, C., Zollitsch, W., and Winiwarter, W.: Evaluating the potential of dietary crude protein manipulation in reducing ammonia emissions from cattle and pig manure: A meta-analysis, Nutr. Cycl. Agroecosys., 110, 161–175, 2018. a
Samer, M., Fiedler, M., Müller, H.-J., Gläser, M., Ammon, C., Berg, W., Sanftleben, P., and Brunsch, R.: Winter measurements of air exchange rates using tracer gas technique and quantification of gaseous emissions from a naturally ventilated dairy barn, Appl. Eng. Agric., 27, 1015–1025, 2011. a
Sanchis, E., Calvet, S., del Prado, A., and Estellés, F.: A meta-analysis of environmental factor effects on ammonia emissions from dairy cattle houses, Biosyst. Eng., 178, 176–183, 2019. a
Schüller, L.-K.: Influence of heat stress on the reproductive performance of dairy cows in the moderate climate of the temperate latitude, PhD thesis, Free University of Berlin, Berlin, Germany, 2015. a
Schütz, K. E., Cox, N. R., and Matthews, L. R.: How important is shade to dairy cattle? Choice between shade or lying following different levels of lying deprivation, Appl. Anim. Behav. Sci., 114, 307–318, 2008. a
Segnalini, M., Bernabucci, U., Vitali, A., Nardone, A., and Lacetera, N.: Temperature humidity index scenarios in the Mediterranean basin, Int. J. Biometeorol., 57, 451–458, 2013. a, b
Spiers, D., Spain, J., Sampson, J., and Rhoads, R.: Use of physiological parameters to predict milk yield and feed intake in heat-stressed dairy cows, J. Therm. Biol., 29, 759–764, 2004. a
Srivastava, N., Hinton, G., Krizhevsky, A., Sutskever, I., and Salakhutdinov, R.: Dropout: A Simple Way to Prevent Neural Networks from Overfitting, J. Mach. Learn. Res., 15, 1929–1958, 2014. a
Steinfeld, H., Mooney, H. A., Schneider, F., and Neville, L. E.: Livestock in a changing landscape, volume 1: drivers, consequences, and responses, Island Press, 2013. a
St-Pierre, N., Cobanov, B., and Schnitkey, G.: Economic losses from heat stress by US livestock industries1, J. Dairy Sci., 86, E52–E77, 2003. a, b
Strutzke, S., Fiske, D., Hoffmann, G., Ammon, C., Heuwieser, W., and Amon, T.: Development of a noninvasive respiration rate sensor for cattle, J. Dairy Sci., 2018. a
Sutton, M., Bleeker, A., Howard, C., Bekunda, M., Grizzetti, B., de Vries, W., van Grinsven, H., Abrol, Y., Adhya, T., Billen, G., Davidson, E., Datta, A., Diaz, R., Erisman, J., Liu, X., Oenema, O., Palm, C., Raghuram, N., Reis, S., Scholz, R., Sims, T., Westhoek, H., and Zhang, F.: Our Nutrient World: the challenge to produce more food and energy with less pollution, NERC/Centre for Ecology & Hydrology, Edinburgh, available at: http://nora.nerc.ac.uk/id/eprint/500700 (last access: 11 April 2019), 2013. a
Trenberth, K. E. and Smith, L.: The Mass of the Atmosphere: A Constraint on Global Analyses, J. Climate, 18, 864–875, https://doi.org/10.1175/JCLI-3299.1, 2005. a
Valtorta, S. E. and Gallardo, M. R.: Evaporative cooling for Holstein dairy cows under grazing conditions, Int. J. Biometeorol., 48, 213–217, 2004. a
van Oldenborgh, G., Collins, M., Arblaster, J., Christensen, J. H., Marotzke, J., Power, S., Rummukainen, M., and Zhou, T.: Annex I: Atlas of Global and Regional Climate Projections, in: Climate Change 2013: The Physical Science Basis, edited by: Stocker, T., Qin, D., Plattner, G.-K., Tignor, M., Allen, S., Boschung, J., Nauels, A., Xia, Y., Bex, V., and Midgley, P., Cambridge University Press, Cambridge, UK and New York, NY, USA, 2013. a
Vitt, R., Weber, L., Zollitsch, W., Hörtenhuber, S. J., Baumgartner, J., Niebuhr, K., Piringer, M., Anders, I., Andre, K., Hennig-Pauka, I., Schönhart, M., and Schauberger, G.: Modelled performance of energy saving air treatment devices to mitigate heat stress for confined livestock buildings in Central Europe, Biosyst. Eng., 164, 85–97, 2017. a
Wang, X., Ndegwa, P. M., Joo, H., Neerackal, G. M., Stöckle, C. O., Liu, H., and Harrison, J. H.: Indirect method versus direct method for measuring ventilation rates in naturally ventilated dairy houses, Biosyst. Eng., 144, 13–25, 2016. a
Wang, X., Gao, H., Gebremedhin, K. G., Bjerg, B. S., Van Os, J., Tucker, C. B., and Zhang, G.: Corrigendum to “A predictive model of equivalent temperature index for dairy cattle (ETIC)”, J. Therm. Biol., 76, 165–170, 2018a. a
Wang, X., Gao, H., Gebremedhin, K. G., Bjerg, B. S., Van Os, J., Tucker, C. B., and Zhang, G.: A predictive model of equivalent temperature index for dairy cattle (ETIC), J. Therm. Biol., 76, 165–170, https://doi.org/10.1016/j.jtherbio.2018.07.013, 2018b. a, b, c, d
Wang, X., Zhang, G., and Choi, C. Y.: Evaluation of a precision air-supply system in naturally ventilated freestall dairy barns, Biosyst. Eng., 175, 1–15, 2018c. a
Warszawski, L., Frieler, K., Huber, V., Piontek, F., Serdeczny, O., and Schewe, J.: The inter-sectoral impact model intercomparison project (ISI–MIP): project framework, P. Natl. Acad. Sci. USA, 111, 3228–3232, 2014. a
Werbos, P. J.: Beyond Regression: New Tools for Prediction and Analysis in the Behavioral Sciences, PhD thesis, Harvard University, Cambridge, USA, 1974. a
West, J.: Effects of heat-stress on production in dairy cattle, J. Dairy Sci., 86, 2131–2144, 2003. a, b, c, d, e, f
Williams, J., Jones, C., Kiniry, J., and Spanel, D. A.: The EPIC crop growth model, T. ASAE, 32, 497–0511, 1989. a
WMO: WMO Statement on the state of the global climate in 2017, in: WMO-No.1212, Publications Board World Meteorological Organization (WMO), World Meteorological Organization, Geneva, Switzerland, 2018. a
Wu, W., Zhai, J., Zhang, G., and Nielsen, P. V.: Evaluation of methods for determining air exchange rate in a naturally ventilated dairy cattle building with large openings using computational fluid dynamics (CFD), Atmos. Environ., 63, 179–188, 2012. a
Yi, Q., König, M., Janke, D., Hempel, S., Zhang, G., Amon, B., and Amon, T.: Wind tunnel investigations of sidewall opening effects on indoor airflows of a cross-ventilated dairy building, Energ. Buildings, 175, 163–172, 2018. a, b, c, d